So we’ve had a few e-mails recently concerning how common it is for athletes to compete in more than one Olympic Games. On the “Mike and Mike” ESPN radio show they speculated that it was actually quite rare for Olympians to compete in more than one Olympics. Thus we decided to look at this in some detail.
Its not actually that rare and further, its becoming more and more common for athletes to compete in 2 or more Olympics. That is especially true of the Winter Olympics. We will only examine the Games since World War II, since the 12-year gap between 1936 and 1948 will skew all results, and this brings us closer to the modern era.
Here are the overall tables for both men and women Olympians at the Summer and Winter Olympics:
[table]
Summer,Total,1G,2G,3G,4G,5G,6+G,1G,2+G
Totals,107696,80048,20001,5731,1449,348,119,74.3%,25.7%
Men,82256,62010,14625,4201,1071,263,86,75.4%,24.6%
Women,25440,18038,5376,1530,378,85,33,70.9%,29.1%
[/table]
[table]
Winter,Total,1G,2G,3G,4G,5G,6+G,1G,2+G
Totals,17459,11510,4059,1384,394,92,20,65.9%,34.1%
Men,12902,8607,2987,948,276,68,16,66.7%,33.3%
Women,4557,2903,1072,436,118,24,4,63.7%,36.3%
[/table]
So its fairly common to compete in more than one Olympics, although overall only about 30% of Olympians get to a second Games. You’ll note, however, that Winter Olympians do it more frequently than summer Olympians – 34.1% to 25.7%. And women seem to come back to a second Olympics slightly more often than do men.
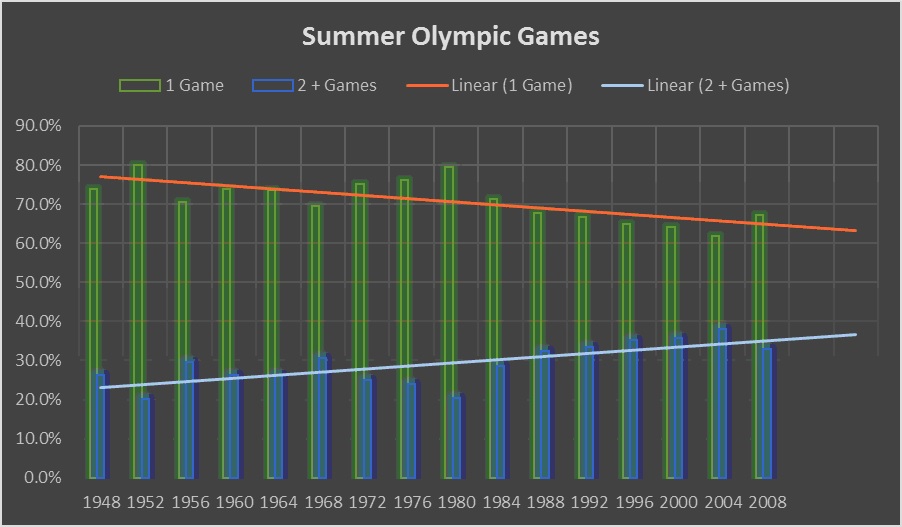
Here are the lists of the Games since 1948, comparing athletes who started at each Olympics, and competed in either 1 or 2 or more (2+) Olympics. We stopped at 2008 and 2010, since anyone who first competed in 2012 or 2014 could only have competed at one Olympics as of February 2016.
[table]
Year,1Games,2+Games,Season
1948,73.8%,26.2%,S
1952,79.9%,20.1%,S
1956,70.5%,29.5%,S
1960,73.8%,26.2%,S
1964,73.7%,26.3%,S
1968,69.4%,30.6%,S
1972,75.1%,24.9%,S
1976,76.1%,23.9%,S
1980,79.6%,20.4%,S
1984,71.3%,28.7%,S
1988,67.7%,32.3%,S
1992,66.6%,33.4%,S
1996,64.8%,35.2%,S
2000,64.2%,35.8%,S
2004,61.9%,38.1%,S
2008,67.2%,32.8%,S
[/table]
[table]
Year,1Games,2+Games,Season
1948,74.6%,25.4%,W
1952,71.4%,28.6%,W
1956,72.1%,27.9%,W
1960,61.5%,38.5%,W
1964,66.5%,33.5%,W
1968,68.7%,31.3%,W
1972,64.9%,35.1%,W
1976,67.0%,33.0%,W
1980,65.5%,34.5%,W
1984,61.4%,38.6%,W
1988,61.1%,38.9%,W
1992,49.4%,50.6%,W
1994,56.8%,43.2%,W
1998,52.0%,48.0%,W
2002,51.6%,48.4%,W
2006,54.5%,45.5%,W
2010,53.8%,46.2%,W
[/table]
It is likely that the 2008 and 2010 numbers will eventually end up with a higher percentage for the 2+ Olympians, as some of those competing in 2008 and 2010 will likely compete in 2016 and 2018. The numbers seem to be increasing and if we look at a graph and determine a best fit for the numbers, its fairly obvious that more and more athletes are competing in 2 or more Olympics.
And here is the graph for the Winter Olympics, where there is now almost equilibrium between 1-time Olympians and those competing in 2 or more Games.
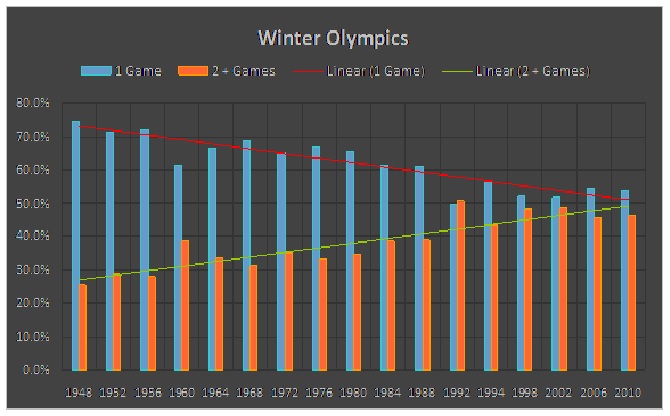
The biggest spike for the Winter Games occurs between 1992 and 1994, when the Winter Olympics had their only gap of 2 years between Games.
Now which sports are particularly suited to Olympians competed more than one time? This is as you would expect, with equestrian, fencing, and shooting figuring prominently. But there are a few surprises, and this time we will look at how often Olympians compete 4 or more times, and 6 or more times. Here is the list by sports for the Summer Games – this include all Olympics since 1896:
[table]
Sport,1Games,2+Games,4+Games,6+Games
Archery,76.0%,24.0%,2.4%,0.3%
Athletics (Track & Field),72.3%,27.7%,1.6%,0.0%
Badminton,65.1%,34.9%,1.7%,0.0%
Baseball,85.7%,14.3%,0.3%,0.0%
Basketball,75.9%,24.1%,1.2%,0.0%
Beach Volleyball,65.7%,34.3%,1.6%,0.0%
Boxing,87.6%,12.4%,0.1%,0.0%
Canoe & Kayaking,66.9%,33.1%,3.2%,0.1%
Cycling,79.2%,20.8%,1.2%,0.1%
Diving,66.0%,34.0%,2.4%,0.0%
Equestrianism,70.4%,29.6%,4.3%,1.1%
Fencing,64.6%,35.4%,4.0%,0.2%
Football (Soccer),92.5%,7.5%,0.2%,0.0%
Golf,99.0%,1.0%,0.0%,0.0%
Gymnastics (Artistic),79.4%,20.6%,0.4%,0.0%
Handball,73.8%,26.2%,1.3%,0.0%
Hockey (Field),69.5%,30.5%,1.3%,0.0%
Judo,72.0%,28.0%,1.5%,0.0%
Modern Pentathlon,74.2%,25.8%,1.3%,0.0%
Rhythmic Gymnastics,87.4%,12.6%,0.2%,0.0%
Rowing & Sculling,76.5%,23.5%,1.4%,0.1%
Rugby Football,95.5%,4.5%,0.0%,0.0%
Sailing (Yachting),73.3%,26.7%,3.5%,0.3%
Shooting,68.9%,31.1%,5.0%,0.7%
Softball,76.0%,24.0%,1.1%,0.0%
Swimming,73.2%,26.8%,1.1%,0.0%
Synchronized Swimming,74.5%,25.5%,0.4%,0.0%
Table Tennis,57.4%,42.6%,7.5%,0.8%
Taekwondo,77.5%,22.5%,0.8%,0.0%
Tennis,69.1%,30.9%,1.7%,0.1%
Trampoline,53.4%,46.6%,4.1%,0.0%
Triathlon,66.3%,33.7%,1.0%,0.0%
Volleyball (Indoor),72.7%,27.3%,1.6%,0.0%
Water Polo,67.0%,33.0%,2.8%,0.0%
Weightlifting,72.7%,27.3%,1.4%,0.0%
Wrestling,72.4%,27.6%,1.4%,0.0%
[/table]
What’s up with table tennis, where over 43% of the Olympians compete more than once? Further, fully 7.5% of Olympic table tennis players have competed in 4 or more Olympics, the highest total for any sport, and that approaches twice as much as equestrian (4.3%) and fencing (4.0%), the two next highest sports for that stat. Looking at Olympians competed in 6 or more Games, only equestrian and table tennis have any significant proportion of their Olympians achieving that, with equestrian leading table tennis – 1.1% to 0.8% – of Olympic table tennis players competing in at least 6 Olympics.
Here is the similar list for the Winter Olympians, looking only at 2+ and 4+ Olympians:
[table]
Sport,1Games,2+Games,4+Games
Alpine Skiing,66.0%,34.0%,2.7%
Biathlon,57.6%,42.4%,5.2%
Bobsledding,73.7%,26.3%,2.7%
Cross-Country Skiing,64.7%,35.3%,4.0%
Curling,76.9%,23.1%,0.0%
Figure Skating,71.1%,28.9%,0.9%
Freestyle Skiing,64.0%,36.0%,4.3%
Ice Hockey,70.9%,29.1%,1.6%
Luge,57.2%,42.8%,6.1%
Nordic Combined,67.4%,32.6%,1.9%
Short-Track Speedskating,60.9%,39.1%,2.1%
Skeleton,74.8%,25.2%,0.0%
Ski Jumping,65.8%,34.2%,2.6%
Snowboarding,64.4%,35.6%,0.7%
Speed Skating,59.0%,41.0%,3.8%
[/table]
Not too surprising is that luge sliders compete in more than one Winter Olympics more frequently than other Winter sport Olympians. But it is surprising that biathletes do so almost as frequently as lugers, and biathlon is a very physically rigorous sport. We really can’t explain that.
So if you want to compete in more than one Olympics, pick your sport carefully, and realize you have a much better chance of doing this than your parents or grandparents did.
Hi Bill:
Truly great stats!! Tremendous job in getting it done..
Have you read the Ollan Cassell memoir, “Inside The Five Ring Circus” ? If not, I’d be happy to send a review copy. I actually did a huge amount of the actual writing for the book…Just send me your mailing address.
Cheers again from
One-Time Olympian Elliott Denman
(USA 50K ’56.)
732-222-9213. [email protected]
Great stuff!
It would also be really interesting to see the stats per event in Track & Field (Athletics) for men and women.
Sounds good. I may do that post as well