This is a revision of a post I did last week on Olympic costs, related to the recent announcement of Rio 2016 costs. I withdrew the post when an error was noted in parts of one column. Unfortunately that column affected several others, so I had to re-do the stats. Thanx to Rich Perelman who noted an error on the numbers for LA 1984, which alerted me to the error in that column.
This revision will be some of what I presented last week, but the revision of the data actually revealed some stats that were new to me and could be important in predicting participation figures and Organizing Committee (OCOG) costs at future Olympic Games, so I will discuss those in some detail. This will be somewhat of a long post but I think an important one.
The Rio de Janeiro Organizing Committee announced the final budget figures for the 2016 Olympics, with expenses of $13.1 billion (US). A huge number and well over the original projected expenses predicted during Rio’s candidature – the Oxford Olympics 2016 Study had Rio costs estimated as $4.6 billion. As I’ll discuss further on, candidature projected expenses are usually not close to the final numbers, but perhaps this post can help with that.
So how expensive was Rio relative to other recent Olympics? We’re only going to look at the numbers since the 1964 Tokyo Olympics, which really started the “modern” era (post-television) of Olympic Games. The table below gives the figures for final expenses given by the Organizing Committees in their final reports. More important is to know how these are corrected against inflation (using US dollar inflation from historical data), which is noted in the right-hand column. The numbers below are given in millions (106) of US dollars, with 2000 as the benchmark year, so $1926 = $1,926,000,000. You can see how important the inflation corrections (IC) are. Tokyo 1964 spent $1.926 billion, but in actuality that would be $11.788 billion in 2000 dollars, more expensive in real dollars than any recent Games except Beijing.
[table]
Year,Host City,106$,IC
1964,Tokyo,$1926,$11788
1968,Mexico City,$175,$979
1972,Munich,$612,$2793
1976,Montréal,$1383,$4636
1980,Moscow,$2000,$4841
1984,Los Angeles,$546,$931
1988,Seoul,$4047,$6021
1992,Barcelona,$7000,$8616
1996,Atlanta,$1686,$1849
2000,Sydney,$2279,$2279
2004,Athens,$11600,$10500
2008,Beijing,$30486,$24493
2012,London,$10778,$7988
2016,Rio de Janeiro,$13100,$9212
[/table]
However, Beijing 2008 was a much, much bigger Olympics than Tokyo 1964. Beijing hosted 203 nations, 10,901 athletes, and 302 events; while Tokyo only hosted 93 nations, 5,137 athletes, and 163 events. A huge difference.
The important comparison between Games appears to be to use constant dollars, correcting for inflation, but also to correct for the number of athletes competing, and the number of events held. You can do a regression analysis and see that both of those factors, as they increase, also increase OCOG costs – I’ll spare you that analysis. More athletes cost more – you have to feed them, house them, and protect them, and some organizing committees also provide travel expenses for some nations’ athletes. More events greatly increase costs because it often means new venues to be built, more security issues for each event, and more facility and personnel costs for each event.
I’ve used this before, but it turns out that the most effective comparison comes when you use the expenses, per athlete, per event, corrected for inflation, which I term EPAECI
EPAECI = expenses / (athletes * events), corrected for inflation
Now let’s see how Rio comes out when we do this comparison.
[table]
Year,Host City,IC,Athletes,Events,EPAECI
1964,Tokyo,$11788,5137,163,$14078
1968,Mexico City,$978,5557,172,$1024
1972,Munich,$2792,7113,195,$2014
1976,Montréal,$4636,6073,198,$3856
1980,Moscow,$4840,5259,203,$4534
1984,Los Angeles,$931,6798,221,$620
1988,Seoul,$6020,8453,237,$3005
1992,Barcelona,$8616,9386,257,$3572
1996,Atlanta,$1848,10340,271,$660
2000,Sydney,$2279,10648,300,$713
2004,Athens,$10499,10561,301,$3303
2008,Beijing,$24493,10901,302,$7440
2012,London,$7988,10519,302,$2515
2016,Rio de Janeiro,$9212,11182,306,$2692
[/table]
The last column is the important one – EPAECI – the statistic of interest, and now Rio 2016 doesn’t look so bad. In fact their EPAECI of $2,692 compares favorably to recent Olympics. Its almost the same as London, and less than Athens 2004, Barcelona 1992, and Seoul 1988. Many of the Games from 1964-2016 had an EPAECI in the $2,500-$3,000 range, and Rio was on the low end of that range. Admittedly the $13.1 billion was well above original projections, but below I’ll show how we can likely actually predict what the final number might be, based only on two relatively known factors.
Here is what the EPAECI looks like graphically:
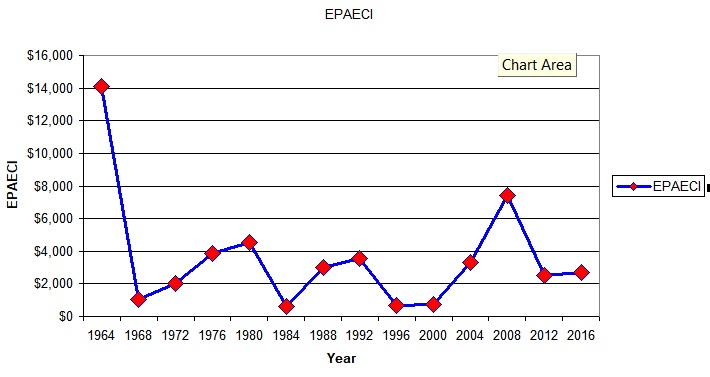
A couple things stand out from this comparison. Tokyo 1964 is by far the most expensive Olympic Games of all-time (summer only – Sochi crushes it including the Winter Games). In fact, Rome 1960 had an EPAECI of $571 so the cost inflation at Tokyo 1964 is an Olympic record of sorts. Secondly, Beijing 2008 is the second most expensive Olympics ever, at a $7,440 EPAECI, which most people probably suspected. Thirdly, Rio now does not look like quite so bad in that chart, does it?
Further, 9 Olympics from the cohort of 14 were fairly similar – there were the expensive outliers of Tokyo 1964 and Beijing 2008, and the parsimonious outliers of Los Angeles 1984, Atlanta 1996, and Sydney 2000, but there are not major differences between the other 9 Olympics Games in term of EPAECI.
One might say that Montreal 1976 and Moscow 1980 were over the historical average, but I would argue that they were not. Both Olympics had boycotts – 1976 by African nations opposed to a recent New Zealand rugby team visiting South Africa in the era of apartheid; and 1980 by a US-led boycott over the recent Soviet invasion of Afghanistan.
Only 92 nations competed at Montreal, and 80 at Moscow, versus 121 at Munich in 1972. About 30 nations boycotted Montreal, and circa 60 boycotted Moscow – it’s not easy to be precise about those numbers. So there should have been about 122 nations at Montreal, and 140 at Moscow, and Montreal and Moscow planned for that many nations, and the requisite increased number of athletes, and spent money based on that planning. If you assume constant numbers of athletes per NOC, Montreal would have had 8,053 athletes and Moscow 9,203. Using those numbers the EPAECI for Montreal comes in at $2,908, and Moscow at $2,591, well within the historical $2,500-$3,000 range.
Finally, three Olympics stand out for their penury – Los Angeles 1984, Atlanta 1996, and Sydney 2000. What do they have in common? None of them were government-run Olympics, with all of them run as businesses that had to balance the books – and they did. These Olympics prove it can be done, but not by increasing costs at every corner, and trying to out-do the previous OCOG, or keeping up with the Joneses. Peter Ueberroth started this policy with Los Angeles 1984. Not always well liked while he was doing it, he should be applauded for showing how it can be done.
Of note, using the arguments above for Montreal and Moscow, the smaller 1984 boycott also makes Los Angeles 1984 look even better, as their EPAECI could have been as low as $560, a number not seen since Melbourne 1956.
However, OCOGs cannot keep costs low if they are forced to add more and more athletes and more and more events, and that is a problem. Rio had 306 events. Tokyo 2020 will likely have 339 events, with the recently announced addition of 15 events, and addition of 5 new sports (18 events) – baseball/softball, karate, skateboarding, sport climbing, and surfing.
The onus, therefore, is on the IOC to decrease costs by minimizing the number of events and keeping the number of athletes as low as possible. The Olympic 2000 Commission, formed ad hoc after the 1999 Olympic Bribery Scandal, recommended maxima of 10,000 athletes, and 300 events. No Summer Olympics since 2000 has achieved either goal.
As I studied the data in looking carefully at the EPAECI, I realized that there is a way to predict how many athletes will compete at an Olympic Games, and it’s very accurate. Since we have reached the 21st century era of 200+ nations competing, and circa 300 events, the following formula has accurately predicted (within 1.5% in each case), the number of athletes that will compete at the Olympics:
Athletes = # Nations * # Events * 0.174
So since the IOC wants every nation to compete, the only effective way to keep down the number of athletes competing is to limit the number of events. Unfortunately, it seems to be going the other way. The only other factor that can be changed in the above formula is the 0.174, which would require having fewer athletes per nation, probably limiting the number of athletes allowed per event, or having stricter qualifying standards.
Now given that we can predict how many athletes compete, it dawned on me that we can also reasonably predict the costs of future Olympic Games. These are not the costs projected by Bid Committees, but actual costs that the OCOG will announce in their final reports. As Dick Pound once said, “Some of the greatest fiction can be found in bid committee books.”
We saw above that most (9/14) Olympics (since 1964) have had an EPAECI in the $2,500-$3,000 range, and I just showed how can we predict the number of athletes that will compete. The number of NOCs competing is now going to be pretty constant at 206 – there are just not many nations left in the world that could compete. If we know the number of events, since we can use NOC = 206, we can use our EPAECI range to estimate final Olympic costs. Let’s see how this works out for 2020-2028, comparing them to 2008-2016. Here we have to project US dollar inflation in the future, and I have used 2.5%/year, which is close to the historical mean.
We have to pick an EPAECI # for Tokyo 2020, Paris 2024, and Los Angeles 2028 (assuming that is how it works out). Tokyo 2020 seems to be overrunning cost estimates, and its previous Olympics set a very poor example, so I will use EPAECI = $3,000 for 2020, on the high end. I will assume Paris 2024 can come in on the low side, so will use EPAECI = $2,500. For Los Angeles 2028, I will go very low, since LA84 was only $620 (or $560 – see above), and Atlanta 1996 was only $660. It appears US-based Olympics (and Sydney 2000), run as businesses, can contain costs. I will not go that low for 2028 but will choose EPAECI = $1,000, well below historical average, but above recent US-Games precedents. In the below table, I have also projected slight increases in number of events for 2024 and 2028. Here are the predicted costs:
[table]
Year,Host,NOCs,Athlts,Evnts,EPAECI,106$,IC
2008,Beijing,203,10901,302,$7440,$30486,$24493
2012,London,203,10519,302,$2515,$10778,$7988
2016,Rio,206,11182,306,$2692,$13100,$9212
2020,Tokyo,206,12150,339,$3000,$19395,$12357
2024,Paris,206,12260,342,$2500,$18161,$10482
2028,LA,206,12360,345,$1000,$8155,$4266
[/table]
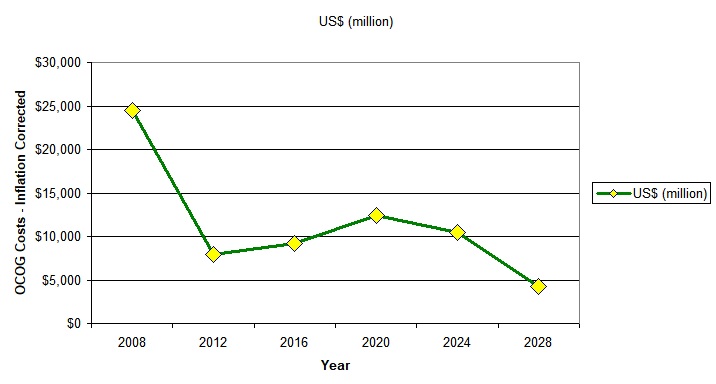
The last 2 columns show the projections, first in actual dollars, and then corrected for inflation. Paris 2024 would come in cheaper than Tokyo 2020, but actually more expensive than London or Rio, and that is because of the increased number of events.
Here are what the figures look like, graphically, first in actual and predicted dollars, and then corrected for inflation:
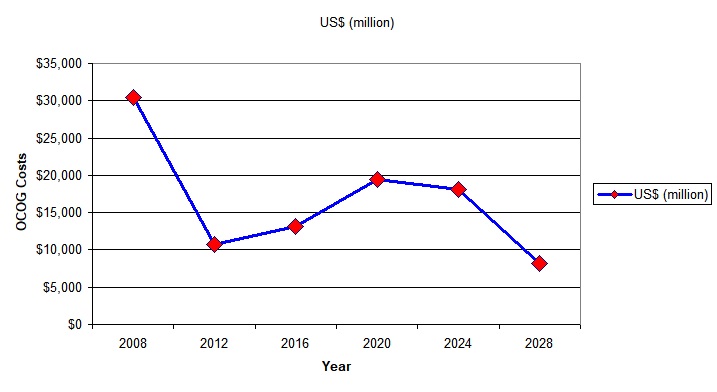
You can see in the above chart how good LA 2028 would look, cost-wise, and also that Paris 2024 will likely come in relatively more expensive than Rio 2016, due to the increased number of events.
Los Angeles 2028 could be the least expensive Olympics since Sydney 2000, at just over $8.1 billion. Since previous US-based Olympics, and Sydney, had EPAECI much lower than $1,000, that estimate for Los Angeles may well be high. Further, I suspect that number for LA 2028 is high, because all of its venues are already built, as opposed to most OCOGs.
There are several take home points from this analysis. 1) Olympic costs are related to the number of athletes competing and the number of events contested, two parameters that are largely outside of OCOG control, but actually controlled by IOC decisions; 2) The IOC can only control these Olympic costs by limiting the number of events contested, although they are going in the other direction, or by limiting the number of athletes per event and per nation, either by having less athletes per nation in each event, or with stricter qualifying standards; 3) Rio 2016 exceeded its predicted costs by a significant factor, but it was not relatively more expensive than recent Games; 4) This highlights that early predictions of Olympic costs by OCOGs are invariably low, and should be looked at with a jaundiced eye; 5) The future number of potential athletes competing can be predicted fairly accurately with a simple formula; 6) Using the predicted number of athletes competing, reasonable estimates can be made of potential Olympic costs using the EPAECI factor. The EPAECI-predicted costs will almost certainly exceed the predicted costs announced by bid committees and OCOGs; and finally, 7) Olympic costs have been well-controlled in the past 50 years by OCOGs that have not been government-run but run as businesses with a careful eye on the bottom line. It can be done.