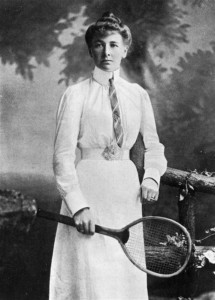
Today, 8 March, is International Women’s Day, which has been celebrated now since 1909. So in terms of the Olympics, which nations have been most fair in promoting female participation? This is a difficult question to answer as many of the most prominent nations have competed in the Olympics for the longest time, when there were far fewer women’s events. But here are the nations that have had the highest percentage of females on their Olympic teams, overall, looking at the Summer Games only:
[table]
NOC,Total,Men,Women,Fem%%%
East Timor,5,2,3,60.0%
Bhutan,19,8,11,57.9%
Saint Kitts and Nevis,17,8,9,52.9%
China,2076,1015,1061,51.1%
Palau,18,9,9,50.0%
DPR Korea (North),325,172,153,47.1%
Saint Lucia,17,9,8,47.1%
São Tomé and Principe,11,6,5,45.5%
Belarus,537,295,242,45.1%
Angola,148,82,66,44.6%
[/table]
Among the major nations, the players you would expect, here is how their Summer Olympic team breakdown works out:
[table]
NOC,Total,Men,Women,Fem%%%
Russia,1633,942,691,42.3%
Jamaica,320,207,113,35.3%
German Demo. Rep.,1129,761,368,32.6%
Romania,1456,995,461,31.7%
New Zealand,1112,760,352,31.7%
The Netherlands,2468,1795,673,27.3%
Germany,3516,2592,924,26.3%
United States,7327,5467,1860,25.4%
Brazil,1708,1279,429,25.1%
Fed. Rep. of Germany,1371,1027,344,25.1%
Great Britain,5281,4011,1270,24.0%
Cuba,1204,918,286,23.8%
Poland,2233,1715,518,23.2%
Sweden,2738,2263,475,17.3%
Norway,1361,1125,236,17.3%
France,4911,4082,829,16.9%
Switzerland,1741,1486,255,14.6%
[/table]
Again, remember that many of these nations competed prior to World War II, when there were very few women’s events.
And what about those nations who have had very few, in some cases, almost no, female Summer Olympians:
[table]
NOC,Total,Men,Women,Fem%%%
Saudi Arabia,142,140,2,1.4%
Kuwait,192,189,3,1.6%
Pakistan,354,346,8,2.3%
Afghanistan,100,97,3,3.0%
Monaco,64,62,2,3.1%
Iraq,174,168,6,3.4%
Qatar,108,104,4,3.7%
Botswana,52,50,2,3.8%
British Virgin Islands,23,22,1,4.3%
Iran,463,441,22,4.8%
[/table]
Among current IOC Member nations, only three have had only 1 female competitor – British Virgin Islands (22), Brunei (5), and Tuvalu (4), while six have had only 2 women compete – Botswana (50), Kiribati (5), Monaco (62), Nauru (6), Oman (37), and Saudi Arabia (140). The numbers in parentheses indicate those nations’ male Olympians

As noted, in those early years, there were very few events for women at the Olympics. How bad was it, Johnny? Here is the breakdown:
[table]
Events,Men,Women,Mixed,Total,Fem%%%,FemEligible
1896,43,0,0,43,0.0%,0.0%
1900,71,2,22,95,2.1%,25.3%
1904,92,3,0,95,3.2%,3.2%
1906,72,1,1,74,1.4%,2.7%
1908,96,3,7,106,2.8%,9.4%
1912,91,5,6,102,4.9%,10.8%
1920,130,7,15,152,4.6%,14.5%
1924,112,10,4,126,7.9%,11.1%
1928,92,14,3,109,12.8%,15.6%
1932,99,14,4,117,12.0%,15.4%
1936,110,15,4,129,11.6%,14.7%
1948,112,19,5,136,14.0%,17.6%
1952,117,25,7,149,16.8%,21.5%
1956,116,26,9,151,17.2%,23.2%
1960,113,29,8,150,19.3%,24.7%
1964,119,33,11,163,20.2%,27.0%
1968,115,39,18,172,22.7%,33.1%
1972,132,43,20,195,22.1%,32.3%
1976,130,49,19,198,24.7%,34.3%
1980,134,50,19,203,24.6%,34.0%
1984,144,62,15,221,28.1%,34.8%
1988,151,72,14,237,30.4%,36.3%
1992,159,86,12,257,33.5%,38.1%
1996,163,97,11,271,35.8%,39.9%
2000,168,120,12,300,40.0%,44.0%
2004,166,125,10,301,41.5%,44.9%
2008,165,127,10,302,42.1%,45.4%
2012,162,132,8,302,43.7%,46.4%
Totals,3374,1208,274,4856,24.9%,30.5%
[/table]
Wojdan Shaherkani, Judo player from Saudi Arabia – London 2012
So, as you can see, prior to World War II, women rarely had even 15% of the events in which they could compete, with the exception of 1900 when there were a lot of mixed events.
How many women have actually competed at the Summer Olympics, as a percentage of the total, since 1896? Here is that table:
[table]
Year,Women,Total,Wom%,WomNOCs,NOCs,%NOC
1896,0,246,0.0%,0,12,0.0%
1900,23,1614,1.4%,6,31,19.4%
1904,6,650,0.9%,1,15,6.7%
1906,6,841,0.7%,2,21,9.5%
1908,44,2023,2.2%,3,22,13.6%
1912,53,2377,2.2%,10,27,37.0%
1920,77,2670,2.9%,14,29,48.3%
1924,135,3067,4.4%,20,44,45.5%
1928,274,2878,9.5%,25,46,54.3%
1932,126,1334,9.4%,19,38,50.0%
1936,329,3956,8.3%,27,49,55.1%
1948,393,4073,9.6%,32,59,54.2%
1952,521,4932,10.6%,41,69,59.4%
1956,383,3344,11.5%,38,72,52.8%
1960,612,5350,11.4%,45,83,54.2%
1964,680,5137,13.2%,53,93,57.0%
1968,783,5557,14.1%,54,112,48.2%
1972,1060,7113,14.9%,67,121,55.4%
1976,1260,6073,20.7%,65,92,70.7%
1980,1123,5259,21.4%,56,80,70.0%
1984,1569,6798,23.1%,95,140,67.9%
1988,2202,8453,26.0%,118,159,74.2%
1992,2723,9386,29.0%,134,169,79.3%
1996,3519,10339,34.0%,168,197,85.3%
2000,4069,10648,38.2%,191,200,95.5%
2004,4304,10561,40.8%,192,201,95.5%
2008,4611,10901,42.3%,195,204,95.6%
2012,4657,10520,44.3%,201,205,98.0%
Totals,25467,107829,23.6%,209,221,94.6%
[/table]
So as we celebrate International Women’s Day, we can see that at the Olympics, in terms of female participation, things were once very bad, they are better now, but there is still a long way to go.
One thought on “International Women’s Day”
Comments are closed.