North Korea at the Winter Olympics

The Democratic People’s Republic of Korea (DPR Korea, or PRK to the IOC), known to most of the world as North Korea, has recently qualified a pairs figure skating duo (Ryom Tae-Ok and Kim Ju-Sik) for the 2018 PyeongChang Winter Olympics. It was not certain any North Korean athletes would qualify, and no North Koreans competed at Sochi in 2014.

DPR Korea first competed at the Olympics in 1964 and it was at the Innsbruck Winter Olympics, with a team of 13 athletes, 6 men and 7 women. Including 1964 they have competed 8 previous times at the Winter Olympics, missing 1968, 1976, 1980, 1994, 2002, and 2014.

DPR Korea has had two Winter Olympic medalists, both women speedskaters. In 1964 Han Pil-Hwa won a silver medal in 3,000 metres speedskating, while in 1992, Hwang Ok-Sil won a bronze medal in 500 metres short-track speedskating. Here is the complete record of their previous Winter Olympic participation.

[table]

WinOly,Men,Women,Total

1964,6,7,13

1972,0,6,6

1984,3,3,6

1988,3,3,6

1992,9,11,20

1998,2,6,8

2006,2,4,6

2010,1,1,2

[/table]

[table]

DPR Korea (North),###,1G,2G

Total,62,57,5

Men,25,24,1

Women,37,33,4

[/table]

[table]

Men – Sport,Nation,###,1G,2G

Alpine Skiing,PRK,1,1,0

Cross-Country Skiing,PRK,4,4,0

Figure Skating,PRK,7,7,0

Speedskating,PRK,10,9,1

Short-Track Speedskating,PRK,3,3,0

[/table]

[table]

Women – Sport,Nation,###,1G,2G

Alpine Skiing,PRK,1,1,0

Cross-Country Skiing,PRK,4,4,0

Figure Skating,PRK,6,6,0

Speedskating,PRK,19,16,3

Short-Track Speedskating,PRK,7,6,1

[/table]

2008-12 Olympic Doping Re-Test – An Update-Update

OK, time for our occasional update on the status of the doping re-tests from the 2008 and 2012 Olympics. Our last post on this topic was in April 2017 – see https://olympstats.com/2017/04/03/2008-2012-doping-re-tests-an-update/, while we first posted about his in November 2016, urged on by Roger Pielke, which we appreciated. For that original post see https://olympstats.com/2016/11/28/summary-of-the-ioc-re-testing-from-2008-2012-to-date/. We’ll keep this a little shorter and just summarize more recent findings.

First of all, there has not been much to update since April 2017. At that time we noted that there had been 182 positive PED tests from the 2008 and 2012 Olympics, and as of 22 Sep, there are now 190 positive tests. A few came out in later April 2017 and one in August but not nearly as much activity as 2015-16.

We are including all positive tests that affect 2008-12 Olympic results. This includes positive tests done in pre-Games testing, original testing at the Olympic Games, re-testing of samples done at a later date, and retroactive disqualifications for other positive tests in the peri-Olympic era that were announced later.

Once again, the former Soviet republics make up the bulk of the nations with positive tests. Here are the 11 nations with the most positive tests:

[table]

NOC,###

Russia,53

Belarus,23

Ukraine,20

Turkey,14

Kazakhstan,12

Azerbaijan,6

Moldova,5

Armenia,4

China,4

Greece,4

Uzbekistan,4

[/table]

And here is a current summary of the 5 sports most affected in 2008-12:

[table]

Sport,###

Athletics,108

Weightlifting,51

Wrestling,9

Equestrian Events,7

Cycling,6

[/table]

Finally, the 5 drugs or violations most responsible for positive tests from 2008-12:

[table]

Substance/Violation,###

Turinabol (dehydrochlormethyltestosterone),83

Stanozolol (anabolic steroid),41

Biological passport offense,34

Oxandrolone,9

Erythropoietin (EPO),7

[/table]

Nothing particularly new in any of that.

Now we can look a little bit more at medal re-assignments. We danced around that a bit in the first two posts on the subject, because medal re-assignments are announced slowly (if at all), and are often subject to litigation or arbitration at the Court of Arbitration for Sport (CAS). Witness the case of Nesta Carter, Jamaican sprinter who won a gold medal in 2008 in the 4×100 relay, alongside one Usain Bolt. Carter had a positive re-test that was announced in late 2016, but it is still in arbitration at the CAS and no final decision has been announced, so the medal has not been removed, neither from Carter, nor Bolt, and thus no medal(s) has/have been re-assigned.

But here are the medal re-assignments we do know about:

  • 2008 Women’s Athletics 10,000 metres.  Elvan Abeylegesse (TUR) [Silver] disqualified. Advance Shalane Flanagan (USA) to silver, and Linet Masai (KEN) to bronze.
  • 2008 Women’s Athletics 4×100 relay.  Russia [Gold] disqualified. Advance Belgium to gold, Nigeria to silver, and Brazil to bronze.
  • 2008 Women’s Athletics 4×400 relay.  Russia [Silver] disqualified. Advance Jamaica to silver, and Great Britain to bronze.
  • 2008 Women’s Athletics 5,000 metres.  Elvan Abeylegesse (TUR) [Silver] disqualified. Advance Meseret Defar (ETH) to silver, and Sylvia Kibet (KEN) to bronze.
  • 2008 Women’s Athletics Discus throw.  Yarelis Barrios (CUB) [Silver] disqualified. Advance Olena Antonova (UKR) to silver and Song Aimin (CHN) to bronze.
  • 2008 Women’s Athletics High jump.  Anna Chicherova (RUS) [Bronze] disqualified. Advance Chaunté Lowe (USA) to bronze.
  • 2008 Women’s Athletics Hammer throw.  Oksana Menkova (BLR) [Gold] disqualified. Advance Yipsi Moreno (CUB) to gold, and Zhang Wenxiu (CHN) to silver.
  • 2008 Women’s Athletics Javelin throw.  Mariya Abakumova (RUS) [Silver] disqualified. Advance Christina Obergföll (GER) to silver.
  • 2008 Women’s Athletics Long jump.  Tatyana Lebedeva (RUS) [Silver] disqualified. Advance Blessing Okagbare (NGR) to silver.
  • 2008 Women’s Athletics Shot put.  Nataliya Khoroneko (BLR) [Silver] and Nadezhda Ostapchuk (BLR) [Bronze] disqualified. Advance Misleydis González (CUB) to silver, and Gong Lijiao (CHN) to bronze.
  • 2008 Women’s Athletics Steeplechase.  Yekaterina Volkova (RUS) [Bronze] disqualified. Advance Tatyana Petrova-Arkhipova (RUS) to bronze.
  • 2008 Men’s Athletics 4×400 relay.  Russia [Bronze] disqualified. Advance Great Britain to bronze.
  • 2008 Men’s Athletics Pole vault.  Denys Yurchenko (UKR) [Bronze] disqualified. Advance Derek Miles (USA) to bronze.
  • 2008 Women’s Modern Pentathlon Individual.  Viktoriya Tereshchuk (UKR) [Bronze] disqualified. Advance Anastasiya Samusevich (BLR) to bronze.
  • 2008 Women’s Weightlifting +75 kg.  Olha Korobka (UKR) [Silver] and Mariya Grabovetskaya (KAZ) [Bronze] disqualified. Advance Ele Opeloge (SAM) to silver, and Maryam Usman (NGR) to bronze.
  • 2008 Women’s Weightlifting 48 kg.  Chen Xiexia (CHN) [Gold] and Sibel Özkan (TUR) [Silver] disqualified. Advance Chen Wei-Ling (TPE) to gold.
  • 2008 Women’s Weightlifting 58 kg.  Marina Shainova (RUS) [Silver] disqualified. Advance Jong-Ae O (PRK) to silver.
  • 2008 Women’s Weightlifting 63 kg.  Irina Nekrasova (KAZ) [Silver] disqualified. Advance Ying-Chi Lu (TPE) to silver.
  • 2008 Women’s Weightlifting 69 kg.  Liu Chunhong (CHN) [Gold] disqualified. Advance Oksana Slivenko (RUS) to gold.
  • 2008 Women’s Weightlifting 75 kg.  Cao Lei (CHN) [Gold] disqualified. Advance Alla Vazhenina (KAZ) to gold.
  • 2008 Men’s Weightlifting 94 kg.  Ilya Ilyin (KAZ) [Gold] disqualified. Advance Szymon Kołecki (POL) to gold.
  • 2008 Men’s Wrestling 120 kg Greco-Roman.  Khasan Baroyev (RUS) [Silver] disqualified. Advance Mindaugas Mizgaitis (LTU) to silver, and Yury Patrikeyev (ARM) to bronze.
  • 2008 Men’s Wrestling 60 kg Greco-Roman.  Vitaliy Rəhimov (AZE) [Silver] disqualified. Advance Nurbakyt Tengizbayev (KAZ) to silver, and Ruslan Tumenbayev (KGZ) to bronze.
  • 2012 Women’s Athletics 800 metres.  Mariya Savinova (RUS) [Gold] disqualified. Advance Caster Semenya (RSA) to gold, and Yekaterina Poistogova (RUS) to silver.
  • 2012 Women’s Athletics 1,500 metres.  Asli Cakir (TUR) [Gold] disqualified. Advance Maryam Jamal (BRN) to gold. No other advancement.
  • 2012 Women’s Athletics 20 km walk.  Olga Kaniskina (RUS) [Silver] disqualified. Advance Qieyang Shenjie (CHN) to silver, and Liu Hong (CHN) to bronze.
  • 2012 Women’s Athletics 4×400 relay.  Russia [Silver] disqualified. Advance Jamaica to silver, and the Ukraine to bronze.
  • 2012 Women’s Athletics Discus throw.  Darya Pishchalnikova (RUS) [Silver] disqualified. Advance Li Yanfeng (CHN) to silver.
  • 2012 Women’s Athletics Hammer throw.  Tatyana Lysenko (RUS) [Gold] disqualified. Advance Anita Włodarczyk (POL) to gold, Betty Heidler (GER) to silver, and Zhang Wenxiu (CHN) to bronze.
  • 2012 Women’s Athletics Shot put.  Yevgeniya Kolodko (RUS) [Silver] disqualified. Advance Gong Lijiao (CHN) to silver, and Li Ling (CHN) to bronze.
  • 2012 Women’s Athletics Steeplechase.  Yuliya Zaripova (RUS) [Gold] disqualified. Advance Habiba Ghribi (TUN) to gold, Sofia Assefa (ETH) to silver, and Milcah Chemos Cheywa (KEN) to bronze.
  • 2012 Men’s Athletics 50 km walk.  Sergey Kirdyapkin (RUS) [Gold] disqualified. Advance Jared Tallent (AUS) to gold, Si Tianfeng (CHN) to silver, and Robbie Heffernan (IRL) to bronze.
  • 2012 Men’s Athletics Javelin throw.  Oleksandr P’iatnytsia (UKR) [Silver] disqualified. Advance Antti Ruuskanen (FIN) to silver and Vitezslav Vesely (CZE) to bronze.
  • 2012 Women’s Weightlifting 53 kg.  Zulfiya Chinshanlo (KAZ) [Gold] disqualified. Advance Shu-Ching Hsu (TPE) to gold.
  • 2012 Women’s Weightlifting 63 kg.  Maiya Maneza (KAZ) [Gold] disqualified. Advance Christine Girard (CAN) to gold.
  • 2012 Men’s Weightlifting 85 kg.  Apti Aukhadov (RUS) [Silver] disqualified. Advance Kianoush Rostami (IRI) to silver.

I will say, as an Olympic statistician, that trying to keep up with these disqualifications and medal re-assignments, and changing all the results, is one of the more challenging things we face.

There will be more as several others are under consideration and, as noted, several are under arbitration with the CAS. The IOC has not always made overt announcements of these medal re-assignments so it can be very difficult to keep track of this, although we have been in contact with people at the IOC to stay on top of it.

So as of mid-September 2017 that is the status of the 2008-12 Olympic doping testing – again, because of the uncertainty in some of the medal re-assignments, please understand that it is to the best of our knowledge.

Olympic Costs and Venue Construction

A few months ago we looked at Olympic costs and how they related to both the number of athletes at the Olympics and the number of events contested, correcting all the figures against inflation. The post can be seen here – https://olympstats.com/2017/06/19/olympic-costs-rio-2016-and-future-projections/.

In that post we briefly touched on venue construction being affected by the number of events but did not analyze it deeply. Venue construction has been mentioned a lot in the recent awarding of the Games to Paris (2024) and Los Angeles (2028), in which Paris noted it had only to build “a few venues” including the Olympic Village and a media centre, while Los Angeles promised it did not need to build a single venue, a fact I look at somewhat dubiously.

When Peter Ueberroth was named head of the Los Angeles Organizing Committee for the 1984 Olympics, he famously later noted that his first project was to go and read all the previous Official Reports, to get some handle on Olympic Costs and what affects them. He did this at the Helms Foundation Library, which no longer exists, but has been subsumed within the LA84 Foundation Library in Los Angeles, a direct offspring of the 1984 Los Angeles Olympics.

Ueberroth noted that, to him, the most important and biggest cost faced by organizing committees (OCOGs) was the need to build venues and he decided he would host the 1984 Olympics by building as few of them as possible. He was helped by the fact that Los Angeles has and had myriad athletic facilities that he was able to use. He did end up having to build a velodrome, a swim stadium, and shooting range, but was able to get the velodrome and swim stadium paid for by sponsors – 7-Eleven and McDonalds, respectively.

So it appears that building venues and stadia is important in terms of the costs of the Olympics, but the question is how important is it, and can we estimate final Olympic costs based on how many venues the OCOG have to build? And is there a way to determine these figures?

Turns out, our Olympic stat group, the OlyMADMen, has compiled information on the venues of all the Olympics, in addition all the other facts our database contains. The venues can be found at our main site – www.olympedia.org – which for now is a private site, although we can provide access. Here is one of those pages of venues:

Further, we have detailed information on each venue, including, in most cases, the dates on which they were constructed. So we have a fairly good estimate of how any venues were constructed for each Olympics. To make this estimate, we made the assumption that any venue built within four years of the Olympics at which it served as a venue was likely constructed for that Olympics.

And what did we find? Here is the table of venue construction since the 1960 Roma Olympics, listing the percentage of all venues that were constructed specifically for each Olympic Games:

[table]

Year,Host City,Venue%

1960,Roma,37.9%

1964,Tokyo,43.3%

1968,Mexico City,24.2%

1972,Munich,30.3%

1976,Montréal,29.2%

1980,Moscow,19.2%

1984,Los Angeles,23.3%

1988,Seoul,46.9%

1992,Barcelona,43.6%

1996,Atlanta,27.6%

2000,Sydney,51.7%

2004,Athens,67.6%

2008,Beijing,67.6%

2012,London,37.9%

2016,Rio de Janeiro,54.1%

[/table]

That doesn’t tell us much, although Los Angeles and Atlanta did not build many venues, and notably, Moscow in 1980 especially did not.

In our last post on Olympic costs, we looked carefully at how those costs were related to the number of athletes and the number of events. Venues are directly related to events, although you might not think so. But when you add new events, you may need to build new venues. Think of whitewater canoeing, which requires a completely new, fairly expensive venue for only a few events added onto the canoeing program. Or BMX cycling and mountain biking, which each require new venues for the cycling program, although the mountain bike venue is relatively construction free.

So since venues and events are related, we preferred to look at how venue construction related to costs per athlete at each Olympic Games. Here are the numbers for venue construction percentage and costs per athlete since 1960, with all figures corrected against inflation, using 2000 US dollars:

[table]

Year,Host City,Venue%,Cost/Athlete

1960,Roma,37.9%,$85658

1964,Tokyo,43.3%,$2294729

1968,Mexico City,24.2%,$176132

1972,Munich,30.3%,$392644

1976,Montréal,29.2%,$763404

1980,Moscow,19.2%,$920500

1984,Los Angeles,23.3%,$136960

1988,Seoul,46.9%,$712264

1992,Barcelona,43.6%,$918012

1996,Atlanta,27.6%,$178787

2000,Sydney,51.7%,$214034

2004,Athens,67.6%,$994191

2008,Beijing,67.6%,$2246903

2012,London,37.9%,$759428

2016,Rio de Janeiro,54.1%,$823864

[/table]

A couple of Games are obvious outliers here. Mainly Tokyo 1964 and Beijing 2008 are by far the most expensive Olympic Games ever (talking only Summer Olympics), which we knew. Further, omitting those 2 outliers, the modern era of costs and construction seems to begin in 1972, so we looked at venue construction vs cost/athlete since 1972, and omitted the absurdly expensive Beijing Olympics. Here is what that comparative table looks like, ranked in ascending order of venue construction percentage (VCP):

[table]

Year,VCP,Cost/Athlete

1980,19.2%,$920500

1984,23.3%,$136960

1996,27.6%,$178787

1976,29.2%,$763404

1972,30.3%,$392644

2012,37.9%,$759428

1992,43.6%,$918012

1988,46.9%,$712264

2000,51.7%,$214034

2016,54.1%,$823864

2004,67.6%,$994191

[/table]

Is there anything we can make of this table, which seems to jump around quite a bit? Here is what the chart looks like for this table:

The dots on the chart are the data points, comparing costs against VCP, while the straight line is the best fit denoting the Pearson correlation coefficient (PCC). The PCC for this comparison is 0.3671. For those not familiar with PCC it analyzes if two sets of data are correlated together, i.e., if one moves up, does the other move up, and vice-versa. The PCC can range from 1 to -1. A PCC of 1 indicates a perfect correlation between two data sets, which rarely exists, while a a PCC of -1 is a perfect negative correlation, meaning if one set of data moves up, the other always moves down. A PCC of 0 equals no significant correlation in either direction.

So what does a PCC of 0.3671 mean? Unfortunately, there is no hard answer to that and it is open to interpretation. It is a positive number, meaning there is some correlation. But it is not very close to 1 so it is, at best, only a fair correlation between Olympic costs per athlete and VCP. Checking the PCC for its statistical significance, one finds it is weak, with a p-value between 0.15 and 0.10.

So this analysis somewhat supports Peter Ueberroth’s original contention, although not strongly. The number of athletes and number of events may still be a better predictor of overall Olympic costs, although venue construction certainly figures into the equation, at least to a degree, and it is directly related to the number of events.

USA OLYMPIANS AND THEIR COLLEGES

This will be somewhat of a different post as it will deal only with USA Olympians. I don’t often do that, trying to always deal with the international set of Olympians but there are some reasons for this.

The post deals with USA Olympians and their college affiliations. This is somewhat unique to the USA that has a strong collegiate sports program, while most other nations focus on club sports.

Further, in some of the work I do with the US Olympic Committee (USOC) I am often asked which states have the most Olympians. That’s a difficult question to answer, trying to tell where somebody is “from.” I am a case in point – born in New Jersey, mostly raised in Massachusetts, lived most of my life in North Carolina, and now live in New Hampshire and South Carolina, I’ve lived in 10 states and 1 Canadian Province. Where the hell am I “from”?

So my default was to list athletes that had been born in a state, died in a state, and attended college in the state, which gave pretty good lists. Unfortunately our database of USA Olympians and their colleges was incomplete.

The reason for that is that we list the affiliations of athletes, but only those at the time of their Olympic participation. So if they attended Harvard, but later competed in the Olympics for the New York Athletic Club, Harvard would not be listed. So I felt like I had to do a fairly complex search to track down as many college affiliations as I could.

It is a Sisyphean task, and one that can never be completed. As I type this, somebody is enrolling in graduate school that I have “missed,” and the list will change yearly, and probably more frequently than that. But with the able assistance of Hilary Evans (@OlyStatman), we’ve come up with very complete lists of USA Olympians and the college affiliations, many of them attending multiple colleges.

As in my day job as a medical journal editor, I must list the inclusion and exclusion criteria. The database we compiled lists USA Olympians only, and only those in medal sports, not including demonstration sports. It does not include USA Olympians who were alternates or did not compete, and it does not include the USA competitors in the Arts Competitions from 1912-48. It also does not include Paralympians.

To be listed with a college affiliation, all we needed to know was if the athlete “attended” such a college – this list says nothing about graduation.

We excluded foreign athletes attending US colleges. Many of our US colleges have hosted foreign athletes who have later competed at the Olympics, but we are not including those, because of the original purpose of the database, as described above.

We excluded coaches, trainers, therapists, physicians, and other ancillary personnel who accompany the Olympic teams. As I attended the greatest university in the United States, and have three degrees from Duke (’73 BA, ’84 MD, ’90 Ortho), I would have liked to include Mike Krzyzewski, and other Duke coaches who have worked at the Olympics, to increase our “Olympian” count, but that is not the purpose of this project.

In summary, the database includes USA Olympians only, who competed in medal sports only, and who attended any known college, USA or otherwise, although the vast majority are US colleges. Many colleges have different lists, including foreign athletes, alternates, demo sport athletes, coaches and affiliate personnel, Paralympians, and others. We have no problems with any such lists, but the purpose of our project was to obtain a list of USA Olympic competitors and their college affiliations so we used the inclusion and exclusion criteria as above.

We have used multiple sources. First we used our Olympedia (www.olympedia.org) database, pulling any college affiliations for USA athletes. We also examined our text bios on the USA Olympians on Olympedia and pulled out the colleges mentioned. Then, we used a USOC database from 1990 that lists college affiliations. All USA Media Guides from 1956-2016 were fully examined. We also checked online lists of colleges and their Olympians. We then were fortunate enough to have contact with CoSIDA (College Sports Information Directors of America), via Doug Vance, their Executive Director, and Bill Hancock, Executive Director of the College Football Playoff. Doug contacted his membership and many of them sent us lists of their Olympians. Thanx to Doug and Bill for their help with this project.

Finally, Hilary Evans (@OlyStatman) did what Hilary always does, and better than anybody, which is find things nobody else can. Hilary went thru the entire list and found many missing and obscure affiliations.

The entire database of USA Olympians and their colleges can be found in the attached Excel spreadsheet (USA Olympians Colleges), but let’s look a little at who the leading colleges are.

The most prominent finding is that California colleges have contributed huge numbers of Olympians to the @TeamUSA effort. In fact the four leading schools, in terms of number of athletes, are: 1) Stanford, 2), UCLA, 3), USC, and 4) Cal Berkeley. Here is the top 20 by # of athletes, games attended, and medals won (Games = # of games attended by their athletes):

[table]

College,Athletes,Games,Medals,Rank

Stanford University,289,408,282,1

UCLA,277,394,241,2

Southern Cal,251,357,228,3

U Cal Berkeley,212,283,201,4

Harvard University,210,276,121,5

Yale University,149,187,113,6

University of Michigan,145,189,131,7

University of Minnesota,140,191,68,8

University of Pennsylvania,131,166,71,9

University of Colorado,128,189,27,10

University of Washington,122,159,72,11

University of Wisconsin,121,172,74,=12

Dartmouth University,121,169,40,=12

The Ohio State University,104,147,98,=14

University of Texas,104,144,123,=14

Indiana University,103,133,95,16

Princeton University,102,135,64,17

Cornell University,92,114,47,18

University of North Carolina,89,121,52,19

Columbia University,80,117,59,20

[/table]

If we break this down by state, one of the original purposes of this search, this becomes even more dramatic. California has almost three times as many Olympians attending college there as the next US state, New York. Here are the top 10 states by # of Olympians:

[table]

State,Athletes,Games,Golds,Medals

California,1668,2363,678,1302

New York,559,795,110,239

Massachusetts,456,604,89,257

Pennsylvania,394,497,67,184

Mchigan,313,415,99,219

Colorado,288,431,28,76

Texas,276,364,157,254

Illinois,238,318,44,120

Minnesota,210,293,22,87

Connecticut,205,262,81,153

[/table]

Pretty dominant for California, isn’t it? Of note, athletes from California colleges have almost as many gold medals and medals as the next 9 highest ranking US states.

What about if we look at Summer and Winter? Surely California colleges cannot have the most Winter Olympians, can they? No, they don’t, that honor going to the University of Minnesota. Here are the lists of the top 10 for Summer and Winter USA Olympians:

[table]

Season,College,Athletes,Games,Gold,Medals

Summer,UCLA,280,396,136,243

Summer,Stanford University,280,394,144,275

Summer,Southern Cal,249,352,114,228

Summer,U Cal Berkeley,202,269,124,199

Summer,Harvard University,160,200,36,85

Summer,Yale University,133,170,52,101

Summer,University of Michigan,129,169,71,121

Summer,University of Pennsylvania,127,162,22,70

Summer,University of Washington,115,149,34,70

Summer,University of Texas,104,144,80,123

[/table]


[table]

Season,College,Athletes,Games,Gold,Medals

Winter,University of Minnesota,93,122,15,49

Winter,Dartmouth University,79,113,5,22

Winter,University of Colorado,61,91,0,9

Winter,Harvard University,50,76,11,36

Winter,University of Utah,46,83,3,9

Winter,University of Wisconsin,44,73,8,32

Winter,University of Vermont,39,61,1,5

Winter,Boston College,37,51,2,20

Winter,Boston University,32,44,5,22

Winter,Northern Michigan University,31,51,4,31

Winter,Westminster College,29,45,2,5

[/table]

What about by gender? Are there any differences among the colleges USA men and women Olympians have attended? Not really big differences, but here are those top 10 lists:

[table]

Gender,College,Athletes,Games,Gold,Medals

Female,UCLA,119,180,74,131

Female,Stanford University,110,163,70,131

Female,Southern Cal,71,111,38,84

Female,U Cal Berkeley,69,102,49,90

Female,University of North Carolina,58,85,22,33

Female,University of Texas,45,61,29,44

Female,University of Wisconsin,42,61,6,29

Female,University of Florida,38,60,30,52

Female,University of Arizona,37,57,28,51

Female,Harvard University,36,58,7,30

[/table]


[table]

Gender,College,Athletes,Games,Gold,Medals

Male,Stanford University,187,255,81,154

Male,Southern Cal,185,252,76,145

Male,Harvard University,183,232,43,100

Male,UCLA,166,223,62,112

Male,U Cal Berkeley,149,189,82,118

Male,Yale University,134,168,53,102

Male,University of Pennsylvania,120,150,19,59

Male,University of Michigan,117,152,66,114

Male,University of Minnesota,111,145,17,46

Male,University of Colorado,97,144,6,21

[/table]

It does get more interesting when we look at sports and years, as many colleges often have certain sports for which they are best known (did I mention Duke and basketball?). Here are the leading 2-3 colleges for each of the sports on the Olympic Program:

[table]

Sport,College,Athletes,Games

Alpine Skiing,University of Colorado,29,40

Alpine Skiing,Dartmouth University,22,31

[/table]

[table]

Sport,College,Athletes,Games

Archery,Arizona State University,5,9

Archery,Texas A&M University,3,7

[/table]

[table]

Sport,College,Athletes,Games

Athletics,Southern Cal,87,121

Athletics,UCLA,72,126

Athletics,Stanford University,54,64

[/table]

[table]

Sport,College,Athletes,Games

Badminton,Arizona State University,5,7

Badminton,UCLA,4,4

[/table]

[table]

Sport,College,Athletes,Games

Baseball,Stanford University,5,5

Baseball,LSU,4,4

[/table]

[table]

Sport,College,Athletes,Games

Basketball,UCLA,15,15

Basketball,University of Tennessee,12,17

Basketball,University of North Carolina,12,13

[/table]

[table]

Sport,College,Athletes,Games

Beach Volleyball,UCLA,13,16

Beach Volleyball,Stanford University,4,7

Beach Volleyball,U Cal Santa Barbara,4,5

[/table]

[table]

Sport,College,Athletes,Games

Biathlon,Dartmouth University,12,15

Biathlon,University of Vermont,5,10

Biathlon,Middlebury College,5,6

[/table]

[table]

Sport,College,Athletes,Games

Bobsledding,SUNY Plattsburgh,8,9

Bobsledding,Cornell University,5,6

[/table]

[table]

Sport,College,Athletes,Games

Boxing,Northern Michigan University,7,7

Boxing,Idaho State University,4,4

Boxing,The Ohio State University,3,3

[/table]

[table]

Sport,College,Athletes,Games

Canoeing,University of Maryland,13,20

Canoeing,Cal State Long Beach,7,9

Canoeing,Dartmouth University,7,8

[/table]

[table]

Sport,College,Athletes,Games

Cross-Country Skiing,Dartmouth University,17,29

Cross-Country Skiing,University of Vermont,12,21

Cross-Country Skiing,Middlebury College,9,14

[/table]

[table]

Sport,College,Athletes,Games

Curling,Bemidji State University,5,6

Curling,University of Wisconsin,4,5

Curling,University of North Dakota,3,3

[/table]

[table]

Sport,College,Athletes,Games

Cycling,University of Colorado,13,16

Cycling,Penn State University,4,7

Cycling,University of Arizona,4,6

Cycling,University of Wisconsin,4,5

Cycling,Cal State Northridge,4,4

Cycling,U Cal Berkeley,4,4

[/table]

[table]

Sport,College,Athletes,Games

Diving,The Ohio State University,21,29

Diving,Indiana University,17,22

Diving,Southern Cal,12,18

[/table]

[table]

Sport,College,Athletes,Games

Equestrian Events,US Military Academy,19,23

Equestrian Events,University of Pennsylvania,3,10

[/table]

[table]

Sport,College,Athletes,Games

Fencing,Columbia University,28,45

Fencing,New York University,25,45

Fencing,University of Pennsylvania,15,25

[/table]

[table]

Sport,College,Athletes,Games

Figure Skating,Harvard University,13,24

Figure Skating,Colorado College,8,11

Figure Skating,University of Colorado,7,9

[/table]

[table]

Sport,College,Athletes,Games

Football,University of North Carolina,20,31

Football,UCLA,17,22

Football,University of Virginia,16,19

[/table]

[table]

Sport,College,Athletes,Games

Freestyle Skiing,University of Utah,11,23

Freestyle Skiing,Westminster College,9,12

[/table]

[table]

Sport,College,Athletes,Games

Golf,Harvard University,3,3

Golf,Columbia University,2,2

Golf,University of Georgia,2,2

[/table]

[table]

Sport,College,Athletes,Games

Gymnastics,UCLA,30,33

Gymnastics,Penn State University,11,12

Gymnastics,University of Illinois,10,15

[/table]

[table]

Sport,College,Athletes,Games

Handball,Adelphi University,7,11

Handball,US Air Force Academy,4,4

[/table]

[table]

Sport,College,Athletes,Games

Hockey,University of North Carolina,17,23

Hockey,Old Dominion University,10,11

Hockey,Princeton University,9,14

[/table]

[table]

Sport,College,Athletes,Games

Ice Hockey,University of Minnesota,68,83

Ice Hockey,Boston College,32,42

Ice Hockey,Harvard University,29,41

[/table]

[table]

Sport,College,Athletes,Games

Judo,San José State University,15,22

Judo,University of Colorado,6,7

[/table]

[table]

Sport,College,Athletes,Games

Luge,University of Montana,5,9

Luge,DeVry University,5,8

[/table]

[table]

Sport,College,Athletes,Games

Modern Pentathlon,US Military Academy,22,23

Modern Pentathlon,University of Texas,3,4

[/table]

[table]

Sport,College,Athletes,Games

Nordic Combined,Dartmouth University,7,8

Nordic Combined,University of Denver,6,6

[/table]

[table]

Sport,College,Athletes,Games

Rowing,Harvard University,72,94

Rowing,University of Washington,66,80

Rowing,U Cal Berkeley,58,67

[/table]

[table]

Sport,College,Athletes,Games

Rugby Football,Stanford University,15,18

Rugby Football,U Cal Berkeley,8,9

Rugby Football,Santa Clara University,5,7

[/table]

[table]

Sport,College,Athletes,Games

Sailing,Harvard University,19,20

Sailing,Yale University,12,17

Sailing,Princeton University,10,12

[/table]

[table]

Sport,College,Athletes,Games

Shooting,West Virginia University,10,16

Shooting,University of Colorado,7,11

Shooting,Troy University,6,10

[/table]

[table]

Sport,College,Athletes,Games

Short-Track Speedskating,Northern Michigan University,19,29

Short-Track Speedskating,University of Colorado,4,6

[/table]

[table]

Sport,College,Athletes,Games

Skeleton,SUNY Plattsburgh,2,3

[/table]

[table]

Sport,College,Athletes,Games

Ski Jumping,Dartmouth University,6,7

Ski Jumping,University of Vermont,4,6

Ski Jumping,University of Wyoming,4,4

[/table]

[table]

Sport,College,Athletes,Games

Snowboarding,Westminster College,5,7

Snowboarding,Colorado Mountain College,3,6

[/table]

[table]

Sport,College,Athletes,Games

Softball,UCLA,11,20

Softball,University of Arizona,4,8

Softball,Cal State Fresno,4,7

[/table]

[table]

Sport,College,Athletes,Games

Speedskating,University of Wisconsin,11,23

Speedskating,University of Minnesota,10,16

Speedskating,Marquette University,7,15

[/table]

[table]

Sport,College,Athletes,Games

Swimming,Stanford University,60,81

Swimming,Southern Cal,59,78

Swimming,University of Texas,51,72

[/table]

[table]

Sport,College,Athletes,Games

Synchronized Swimming,The Ohio State University,5,8

Synchronized Swimming,Stanford University,5,7

Synchronized Swimming,DeAnza College,5,5

[/table]

[table]

Sport,College,Athletes,Games

Table Tennis,Princeton University,2,2

[/table]

[table]

Sport,College,Athletes,Games

Tennis,Stanford University,6,10

Tennis,Harvard University,5,5

[/table]

[table]

Sport,College,Athletes,Games

Volleyball,Southern Cal,24,34

Volleyball,UCLA,19,25

Volleyball,Stanford University,17,27

[/table]

[table]

Sport,College,Athletes,Games

Water Polo,Stanford University,39,64

Water Polo,UCLA,37,52

Water Polo,Southern Cal,27,35

[/table]

[table]

Sport,College,Athletes,Games

Weightlifting,Pikes Peak Community College,4,5

Weightlifting,The Ohio State University,3,6

Weightlifting,University of Illinois,3,6

Weightlifting,Southwestern Louisiana University,3,4

Weightlifting,U Colorado-Colorado Springs,3,3

[/table]

[table]

Sport,College,Athletes,Games

Wrestling,Oklahoma State University,29,37

Wrestling,University of Oklahoma,15,23

Wrestling,Iowa State University,14,15

[/table]

The above are not separated by gender and you can see the female influence in several sports, notably in basketball, where the University of Tennessee ranks highly, and football (soccer), where the University of North Carolina ranks first, both based primarily on their female players.

Certain schools appear frequently on the above lists, as you would expect. Notably, Stanford and UCLA are among the top 3 in 9 sports, while Dartmouth, Harvard, and the University of Colorado are listed in 6 sports.

And here is how the top colleges have changed over the years, looking only at the top USA colleges represented at each Games:

[table]

Season,Year,College,Athletes

Summer,1896,Harvard University,6

Summer,1900,University of Pennsylvania,12

Summer,1904,Christian Brothers’ College St. Louis,11

Summer,,Yale University,11

Summer,1906,Yale University,3

Summer,1908,Cornell University,9

Summer,1912,Cornell University,8

Summer,,Harvard University,8

Summer,1920,US Naval Academy,22

Summer,1924,Stanford University,19

Summer,1928,Southern Cal,13

Summer,1932,Southern Cal,15

Summer,1936,Southern Cal,21

Summer,1948,U Cal Berkeley,14

Summer,,Southern Cal,14

Summer,1952,Southern Cal,17

Summer,1956,Southern Cal,19

Summer,1960,Southern Cal,23

Summer,1964,Southern Cal,26

Summer,1968,UCLA,16

Summer,1972,UCLA,27

Summer,1976,UCLA,31

Summer,1984,UCLA,35

Summer,1984,U Cal Berkeley,16

Summer,1988,UCLA,28

Summer,1992,UCLA,27

Summer,1996,UCLA,35

Summer,2000,UCLA,40

Summer,2004,UCLA,34

Summer,2008,Stanford University,31

Summer,2012,Stanford University,29

Summer,2016,Stanford University,30

[/table]


[table]

Season,Year,College,Athletes

Winter,1920,Dartmouth University,2

Winter,1924,Harvard University,2

Winter,1928,Harvard University,3

Winter,1932,Yale University,7

Winter,1936,Dartmouth University,4

Winter,,Harvard University,4

Winter,1948,Dartmouth University,8

Winter,1952,University of Minnesota,9

Winter,1956,University of Minnesota,7

Winter,1960,University of Minnesota,9

Winter,1964,University of Minnesota,13

Winter,1968,University of Minnesota,10

Winter,1972,University of Colorado,11

Winter,1976,University of Wisconsin,9

Winter,1980,University of Minnesota,9

Winter,1984,University of Minnesota,9

Winter,1988,University of Vermont,7

Winter,1992,Dartmouth University,9

Winter,1994,Northern Michigan University,11

Winter,1998,University of Colorado,12

Winter,2002,University of Utah,12

Winter,2006,University of Utah,11

Winter,2010,Westminster College,18

Winter,2014,Westminster College,19

[/table]

There you can see some trends. In the early years of US Olympic participation the Ivy League schools contributed the most Summer Olympians, while since 1924 it has always been a California school.

Finally, one thing is obvious about this analysis – there have been a lot of smart young men and women on @TeamUSA, but we went a bit further. What about graduate schools?

We have that information as well, broken down by type of graduate or professional school, so here we list the top schools by each type, but also the known number of USA Olympians for each type of graduate or professional school.

[table]

Type,GradProf,Athletes

Business School,Harvard University,8

Business School,Stanford University,6

Business School,University of Pennsylvania,4

Business School,Totals,52

[/table]

[table]

Type,GradProf,Athletes

Chiropractic School,Cleveland Chiropractic College,2

Chiropractic School,Totals,5

[/table]

[table]

Type,GradProf,Athletes

Dental School,Indiana University,1

Dental School,Loyola University New Orleans,1

Dental School,New York University,1

Dental School,Temple University,1

Dental School,The Ohio State University,1

Dental School,University of the Pacific,1

Dental School,Totals,6

[/table]

[table]

Type,GradProf,Athletes

Graduate School,Columbia University,13

Graduate School,Stanford University,10

Graduate School,The Ohio State University,10

Graduate School,University of Pennsylvania,10

Graduate School,Totals,255

[/table]

[table]

Type,GradProf,Athletes

Law School,Harvard University,11

Law School,Columbia University,4

Law School,Cornell University,3

Law School,Stanford University,3

Law School,U Cal Berkeley,3

Law School,University of Chicago,3

Law School,Southern Cal,3

Law School,Totals,70

[/table]

[table]

Type,GradProf,Athletes

Medical School,Harvard University,4

Medical School,University of Pennsylvania,4

Medical School,Columbia University,3

Medical School,Stanford University,3

Medical School,University of Cincinnati,3

Medical School,Totals,69

[/table]

[table]

Type,GradProf,Athletes

Rhodes Scholar,Oxford University (GBR) (Balliol College),2

Rhodes Scholar,Oxford University (GBR) (Magdalen College),2

Rhodes Scholar,Oxford University (GBR) (St. John’s College),2

Rhodes Scholar,Totals,9

[/table]

[table]

Type,GradProf,Athletes

Veterinary School,University of Pennsylvania,2

Veterinary School,Totals,5

[/table]

Impressive that these tremendous athletes, who spend so much time training and competing, have also excelled academically. As to the Rhodes Scholars, there have been 34 known Rhodes Scholars among all Olympians, with 9 of those coming from the United States. Here is that list:

[table]

Name,NOC,Sport,Rhodes

Bill Bradley,USA,BAS,1965 Rhodes Scholar – Worcester College

John Carleton,USA,CCS/NCO,1922 Rhodes Scholar – Magdalen College

Eddie Eagan,USA,BOB/BOX,1922 Rhodes Scholar – New College

Tom McMillen,USA,BAS,1974 Rhodes Scholar – University College

John Misha Petkevich,USA,FSK,1973 Rhodes Scholar – Magdalen College

Annette Salmeen,USA,SWI,1997 Rhodes Scholar – St. John’s College

Bill Stevenson,USA,ATH,1922 Rhodes Scholar – Balliol College

Norm Taber,USA,ATH,1913 Rhodes Scholar – St. John’s College

Alan Valentine,USA,RUG,1922 Rhodes Scholar – Balliol College

[/table]

So that’s it. Full details can be found in the spreadsheet that lists all USA Olympians and their academic affiliations, which is linked above. Let us know if you see any errors or additions. As we stated, the list can never be complete and almost by necessity, is certainly incomplete.


Olympic Costs – Rio 2016 and Future Projections

This is a revision of a post I did last week on Olympic costs, related to the recent announcement of Rio 2016 costs. I withdrew the post when an error was noted in parts of one column. Unfortunately that column affected several others, so I had to re-do the stats. Thanx to Rich Perelman who noted an error on the numbers for LA 1984, which alerted me to the error in that column.

This revision will be some of what I presented last week, but the revision of the data actually revealed some stats that were new to me and could be important in predicting participation figures and Organizing Committee (OCOG) costs at future Olympic Games, so I will discuss those in some detail. This will be somewhat of a long post but I think an important one.

The Rio de Janeiro Organizing Committee announced the final budget figures for the 2016 Olympics, with expenses of $13.1 billion (US). A huge number and well over the original projected expenses predicted during Rio’s candidature – the Oxford Olympics 2016 Study had Rio costs estimated as $4.6 billion. As I’ll discuss further on, candidature projected expenses are usually not close to the final numbers, but perhaps this post can help with that.

So how expensive was Rio relative to other recent Olympics? We’re only going to look at the numbers since the 1964 Tokyo Olympics, which really started the “modern” era (post-television) of Olympic Games. The table below gives the figures for final expenses given by the Organizing Committees in their final reports. More important is to know how these are corrected against inflation (using US dollar inflation from historical data), which is noted in the right-hand column. The numbers below are given in millions (106) of US dollars, with 2000 as the benchmark year, so $1926 = $1,926,000,000. You can see how important the inflation corrections (IC) are. Tokyo 1964 spent $1.926 billion, but in actuality that would be $11.788 billion in 2000 dollars, more expensive in real dollars than any recent Games except Beijing.

[table]

Year,Host City,106$,IC

1964,Tokyo,$1926,$11788

1968,Mexico City,$175,$979

1972,Munich,$612,$2793

1976,Montréal,$1383,$4636

1980,Moscow,$2000,$4841

1984,Los Angeles,$546,$931

1988,Seoul,$4047,$6021

1992,Barcelona,$7000,$8616

1996,Atlanta,$1686,$1849

2000,Sydney,$2279,$2279

2004,Athens,$11600,$10500

2008,Beijing,$30486,$24493

2012,London,$10778,$7988

2016,Rio de Janeiro,$13100,$9212

[/table]

However, Beijing 2008 was a much, much bigger Olympics than Tokyo 1964. Beijing hosted 203 nations, 10,901 athletes, and 302 events; while Tokyo only hosted 93 nations, 5,137 athletes, and 163 events. A huge difference.

The important comparison between Games appears to be to use constant dollars, correcting for inflation, but also to correct for the number of athletes competing, and the number of events held.  You can do a regression analysis and see that both of those factors, as they increase, also increase OCOG costs – I’ll spare you that analysis. More athletes cost more – you have to feed them, house them, and protect them, and some organizing committees also provide travel expenses for some nations’ athletes. More events greatly increase costs because it often means new venues to be built, more security issues for each event, and more facility and personnel costs for each event.

I’ve used this before, but it turns out that the most effective comparison comes when you use the expenses, per athlete, per event, corrected for inflation, which I term EPAECI

EPAECI = expenses / (athletes * events), corrected for inflation

Now let’s see how Rio comes out when we do this comparison.

[table]

Year,Host City,IC,Athletes,Events,EPAECI

1964,Tokyo,$11788,5137,163,$14078

1968,Mexico City,$978,5557,172,$1024

1972,Munich,$2792,7113,195,$2014

1976,Montréal,$4636,6073,198,$3856

1980,Moscow,$4840,5259,203,$4534

1984,Los Angeles,$931,6798,221,$620

1988,Seoul,$6020,8453,237,$3005

1992,Barcelona,$8616,9386,257,$3572

1996,Atlanta,$1848,10340,271,$660

2000,Sydney,$2279,10648,300,$713

2004,Athens,$10499,10561,301,$3303

2008,Beijing,$24493,10901,302,$7440

2012,London,$7988,10519,302,$2515

2016,Rio de Janeiro,$9212,11182,306,$2692

[/table]

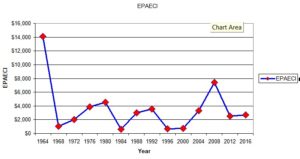
The last column is the important one – EPAECI – the statistic of interest, and now Rio 2016 doesn’t look so bad. In fact their EPAECI of $2,692 compares favorably to recent Olympics. Its almost the same as London, and less than Athens 2004, Barcelona 1992, and Seoul 1988. Many of the Games from 1964-2016 had an EPAECI in the $2,500-$3,000 range, and Rio was on the low end of that range. Admittedly the $13.1 billion was well above original projections, but below I’ll show how we can likely actually predict what the final number might be, based only on two relatively known factors.

Here is what the EPAECI looks like graphically:

A couple things stand out from this comparison. Tokyo 1964 is by far the most expensive Olympic Games of all-time (summer only – Sochi crushes it including the Winter Games). In fact, Rome 1960 had an EPAECI of $571 so the cost inflation at Tokyo 1964 is an Olympic record of sorts. Secondly, Beijing 2008 is the second most expensive Olympics ever, at a $7,440 EPAECI, which most people probably suspected. Thirdly, Rio now does not look like quite so bad in that chart, does it?

Further, 9 Olympics from the cohort of 14 were fairly similar – there were the expensive outliers of Tokyo 1964 and Beijing 2008, and the parsimonious outliers of Los Angeles 1984, Atlanta 1996, and Sydney 2000, but there are not major differences between the other 9 Olympics Games in term of EPAECI.

One might say that Montreal 1976 and Moscow 1980 were over the historical average, but I would argue that they were not. Both Olympics had boycotts – 1976 by African nations opposed to a recent New Zealand rugby team visiting South Africa in the era of apartheid; and 1980 by a US-led boycott over the recent Soviet invasion of Afghanistan.

Only 92 nations competed at Montreal, and 80 at Moscow, versus 121 at Munich in 1972. About 30 nations boycotted Montreal, and circa 60 boycotted Moscow – it’s not easy to be precise about those numbers. So there should have been about 122 nations at Montreal, and 140 at Moscow, and Montreal and Moscow planned for that many nations, and the requisite increased number of athletes, and spent money based on that planning. If you assume constant numbers of athletes per NOC, Montreal would have had 8,053 athletes and Moscow 9,203. Using those numbers the EPAECI for Montreal comes in at $2,908, and Moscow at $2,591, well within the historical $2,500-$3,000 range.

Finally, three Olympics stand out for their penury – Los Angeles 1984, Atlanta 1996, and Sydney 2000. What do they have in common? None of them were government-run Olympics, with all of them run as businesses that had to balance the books – and they did. These Olympics prove it can be done, but not by increasing costs at every corner, and trying to out-do the previous OCOG, or keeping up with the Joneses. Peter Ueberroth started this policy with Los Angeles 1984. Not always well liked while he was doing it, he should be applauded for showing how it can be done.

Of note, using the arguments above for Montreal and Moscow, the smaller 1984 boycott also makes Los Angeles 1984 look even better, as their EPAECI could have been as low as $560, a number not seen since Melbourne 1956.

However, OCOGs cannot keep costs low if they are forced to add more and more athletes and more and more events, and that is a problem. Rio had 306 events. Tokyo 2020 will likely have 339 events, with the recently announced addition of 15 events, and addition of 5 new sports (18 events) – baseball/softball, karate, skateboarding, sport climbing, and surfing.

The onus, therefore, is on the IOC to decrease costs by minimizing the number of events and keeping the number of athletes as low as possible. The Olympic 2000 Commission, formed ad hoc after the 1999 Olympic Bribery Scandal, recommended maxima of 10,000 athletes, and 300 events. No Summer Olympics since 2000 has achieved either goal.

As I studied the data in looking carefully at the EPAECI, I realized that there is a way to predict how many athletes will compete at an Olympic Games, and it’s very accurate. Since we have reached the 21st century era of 200+ nations competing, and circa 300 events, the following formula has accurately predicted (within 1.5% in each case), the number of athletes that will compete at the Olympics:

Athletes = # Nations * # Events * 0.174

So since the IOC wants every nation to compete, the only effective way to keep down the number of athletes competing is to limit the number of events. Unfortunately, it seems to be going the other way. The only other factor that can be changed in the above formula is the 0.174, which would require having fewer athletes per nation, probably limiting the number of athletes allowed per event, or having stricter qualifying standards.

Now given that we can predict how many athletes compete, it dawned on me that we can also reasonably predict the costs of future Olympic Games. These are not the costs projected by Bid Committees, but actual costs that the OCOG will announce in their final reports. As Dick Pound once said, “Some of the greatest fiction can be found in bid committee books.”

We saw above that most (9/14) Olympics (since 1964) have had an EPAECI in the $2,500-$3,000 range, and I just showed how can we predict the number of athletes that will compete. The number of NOCs competing is now going to be pretty constant at 206 – there are just not many nations left in the world that could compete. If we know the number of events, since we can use NOC = 206, we can use our EPAECI range to estimate final Olympic costs. Let’s see how this works out for 2020-2028, comparing them to 2008-2016. Here we have to project US dollar inflation in the future, and I have used 2.5%/year, which is close to the historical mean.

We have to pick an EPAECI # for Tokyo 2020, Paris 2024, and Los Angeles 2028 (assuming that is how it works out). Tokyo 2020 seems to be overrunning cost estimates, and its previous Olympics set a very poor example, so I will use EPAECI = $3,000 for 2020, on the high end. I will assume Paris 2024 can come in on the low side, so will use EPAECI = $2,500. For Los Angeles 2028, I will go very low, since LA84 was only $620 (or $560 – see above), and Atlanta 1996 was only $660. It appears US-based Olympics (and Sydney 2000), run as businesses, can contain costs. I will not go that low for 2028 but will choose EPAECI = $1,000, well below historical average, but above recent US-Games precedents. In the below table, I have also projected slight increases in number of events for 2024 and 2028. Here are the predicted costs:

[table]

Year,Host,NOCs,Athlts,Evnts,EPAECI,106$,IC

2008,Beijing,203,10901,302,$7440,$30486,$24493

2012,London,203,10519,302,$2515,$10778,$7988

2016,Rio,206,11182,306,$2692,$13100,$9212

2020,Tokyo,206,12150,339,$3000,$19395,$12357

2024,Paris,206,12260,342,$2500,$18161,$10482

2028,LA,206,12360,345,$1000,$8155,$4266

[/table]

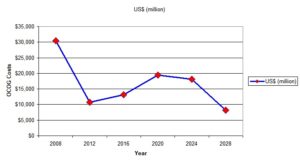
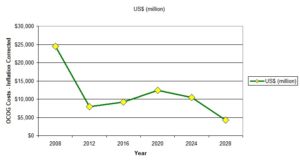
The last 2 columns show the projections, first in actual dollars, and then corrected for inflation. Paris 2024 would come in cheaper than Tokyo 2020, but actually more expensive than London or Rio, and that is because of the increased number of events.

Here are what the figures look like, graphically, first in actual and predicted dollars, and then corrected for inflation:

You can see in the above chart how good LA 2028 would look, cost-wise, and also that Paris 2024 will likely come in relatively more expensive than Rio 2016, due to the increased number of events.

Los Angeles 2028 could be the least expensive Olympics since Sydney 2000, at just over $8.1 billion. Since previous US-based Olympics, and Sydney, had EPAECI much lower than $1,000, that estimate for Los Angeles may well be high. Further, I suspect that number for LA 2028 is high, because all of its venues are already built, as opposed to most OCOGs.

There are several take home points from this analysis. 1) Olympic costs are related to the number of athletes competing and the number of events contested, two parameters that are largely outside of OCOG control, but actually controlled by IOC decisions; 2) The IOC can only control these Olympic costs by limiting the number of events contested, although they are going in the other direction, or by limiting the number of athletes per event and per nation, either by having less athletes per nation in each event, or with stricter qualifying standards; 3) Rio 2016 exceeded its predicted costs by a significant factor, but it was not relatively more expensive than recent Games; 4) This highlights that early predictions of Olympic costs by OCOGs are invariably low, and should be looked at with a jaundiced eye; 5) The future number of potential athletes competing can be predicted fairly accurately with a simple formula; 6) Using the predicted number of athletes competing, reasonable estimates can be made of potential Olympic costs using the EPAECI factor. The EPAECI-predicted costs will almost certainly exceed the predicted costs announced by bid committees and OCOGs; and finally, 7) Olympic costs have been well-controlled in the past 50 years by OCOGs that have not been government-run but run as businesses with a careful eye on the bottom line. It can be done.

Olympic Program Metastasis

The IOC today announced multiple changes to the Tokyo 2020 Olympic Programme, adding numerous mixed events, several “street” events (such as 3×3 hoops), and trying to equalize the program by genders. One thing this will do, however, is greatly increase the size of the 2020 Olympics, something the IOC has been trying to ward off.

In 2000, in the wake of the Olympic Bribery Scandal, the IOC formed the IOC 2000 Commission to look at ways to revise the Olympic Movement and Games. Two of the recommendations were to limit the size of the Summer Olympics to 300 events and 10,000 athletes. Rio 2016 had 306 events and 11,182 athletes, and no Olympics since 2000 has had less than 10,500 competitors.

The IOC announced that there will now be 321 events at Tokyo, and by limiting athlete quotas in many sports, will decrease the number of competitors by 285 athletes. However, they did not take into account the 5 new proposed sports, which have been assumed to be a fait accompli – baseball/softball, karate, skateboarding, sport climbing, and surfing. If one looks at the IOC’s own publication on this – see  https://stillmed.olympic.org/media/Document%20Library/OlympicOrg/…/Olympic-Pr…  – that would add another 18 events, bringing the total to 339 events for Tokyo 2020. Further, the IOC is projecting 474 additional athletes in the new sports, which more than eliminates the savings from the new sports quotas. This would bring the projected Rio total to about 11,500 athletes, and I would not be surprised to see it reach close to 12,000.

Here is how the Summer Olympic program has expanded since WW2:

[table]

Events,Men,Wom,Mix,Tot,Increase,Men%,Women%

1948,112,19,5,136,5.4%,86.0%,17.6%

1952,117,25,7,149,9.6%,83.2%,21.5%

1956,116,26,9,151,1.3%,82.8%,23.2%

1960,113,29,8,150,-0.7%,80.7%,24.7%

1964,119,33,11,163,8.7%,79.8%,27.0%

1968,115,39,18,172,5.5%,77.3%,33.1%

1972,132,43,20,195,13.4%,77.9%,32.3%

1976,130,49,19,198,1.5%,75.3%,34.3%

1980,134,50,19,203,2.5%,75.4%,34.0%

1984,144,62,15,221,8.9%,71.9%,34.8%

1988,151,72,14,237,7.2%,69.6%,36.3%

1992,159,86,12,257,8.4%,66.5%,38.1%

1996,163,97,11,271,5.4%,64.2%,39.9%

2000,168,120,12,300,10.7%,60.0%,44.0%

2004,166,125,10,301,0.3%,58.5%,44.9%

2008,165,127,10,302,0.3%,57.9%,45.4%

2012,162,132,8,302,0.0%,56.3%,46.4%

2016,161,136,9,306,1.3%,55.6%,47.4%

2020,156,147,18,321,4.9%,54.2%,51.4%

2020Plus,165,156,18,339,10.8%,54.0%,51.3%

[/table]

2020Plus are the numbers assuming the 5 new sports are accepted as proposed. That would come to 339 events and a 10.8% increase over the size of the Olympic Program. Since 1948 that will be the second biggest increase, after a 13.4% increase for Munich 1972. It is also about the same as Sydney 2000, which increased by 10.7%. The Munich increase was driven by a few new sports (archery, handball, and judo returned to the program after missing 1968), and new weight classes for men in weightlifting and wrestling. The Sydney increase was from a few new sports / disciplines (trampoline, triathlon, taekwondo), but mainly from adding women’s sports and events – modern pentathlon, water polo, weightlifting.

If you look at the table you will see the IOC is approaching gender equity with the program. Women will be able to compete in 51.3% of the 2020Plus Program, while men will be eligible in 54.0% of the Program (it adds to > 100% because of mixed events).

That is admirable and there are certainly no complaints about it. It follows Bach’s proposals in Agenda 2020 to have an event-based program instead of a sport-based one, and to achieve gender equity. But with a proposed 339 events, and maybe approaching 12,000 athletes, one has to wonder when the current era is one in which cities are refusing to bid for Olympics because they have become too big and too expensive. It may require further IOC legerdemain to reverse that trend.

Oldest Living Olympians

Adolph Kiefer died this morning (5 May) at his home in Wadsworth, Illinois. He was 1 month shy of 99-years-old. Kiefer was the world’s greatest backstroker in the 1930s and won a gold medal at the 1936 Olympics in the 100 backstroke. At his death he was the seond oldest living Olympic medalist and gold medalist.

Our OlyMADMen group has one remarkable guy, Canadian Paul, actually known as Paul Tchir, whose hobby is studying the ages of Olympians and determining the oldest living this or that. He has a private Wikipedia page where he tracks these – see https://en.wikipedia.org/wiki/User:Canadian_Paul/Olympics.

For the record here are the current oldest Olympian records, courtesy of Canadian Paul’s webpage.

Oldest Living Olympian / US Olympian

John Lysak           16 Aug 1914   None      USA               1936 WLT


Oldest Living Olympic Medalist

Clara Marangoni    13 Nov 1915   Silver      ITA                1928 GYM


Oldest Living Olympic Gold Medalist

Durward Knowles  02 Nov 1917   Gold       BAH/GBR       Multiple SAI


Oldest Living US Olympic Medalist

John Russell         02 Feb 1920   Bronze    USA               1948 EQU


Oldest Living US Olympic Gold Medalist

Cliff Bourland        01 Jan 1921    Gold       USA               1948 ATH


For the record, besides Lysak, there is one other US Olympian still alive from the 1936 Berlin Olympics – Iris Cummings, a swimmer who was born 21 December 1920. Canadian Paul lists 9 Olympians in all still alive from those Games. There are no known Olympians alive from the 1932 Olympics, although Clara Marangoni (above) competed at the 1928 Amsterdam Olympics.

Winter Olympic All-Time Medal Table Predictions

With the 2018 Olympic Winter Games now less than 10 months away, I have started looking at some stats related to the Winter Olympics. Since I often work with the US Olympic Committee at the Olympics, this has also entailed looking at @TeamUSA stats. One interesting stat is that the USA has won 96 gold medals at the Winter Olympics, and barring a complete reversal of recent performances, will go over 100 in PyeongChang.

I was also interested in how the USA stacks up on the overall medal list, and I noted that they are second, behind Norway in both gold medals and total medals won, but also that, over the last few Winter Olympics, they have moving up the list. The top four nations at the Olympic Games, in terms of medals won, are as follows:

[table]

Rank,NOC,G,S,B,TM

1,Norway,118,113,101,332

2,United States,96,103,85,284

3,Germany,87,85,58,230

4,Austria,59,78,81,218

[/table]

I’m not going to look any further at Austria. It looks like it is close to the top 3 nations, only slightly behind Germany, but in fact, it is much further behind than the above stats reveal. That is because Germany only includes medals won as a combined Germany, and from 1968-88 both West Germany (FRG) and East Germany (GDR) competed and if you include those medals, Austria is far behind.

Over the last few Olympics, the USA has improved a great deal and seemed to be closing in on Norway in terms of medals won and golds won. I was curious if this trend continued, when the USA might overtake Norway, if they did at all, or perhaps Germany might also do so.

Germany would be ahead now if the country had not been divided. Counting Germany and the GDR, they would have 126 gold medals and 340 medals, and lead both lists. Counting Germany and West Germany, they would have 98 golds, and 269 medals, distancing Austria. If you count a combined German team, counting all German medals, they have 137 golds and 379 medals, far ahead in both categories. That is, however, somewhat of a specious argument as from 1968-88 such a United Germany would have had 6-8 competitors in many individual events, far more than usually allowed.

For future predictions, the important years to look at are 1992-2014, because in 1992 Germany was again a unified nation. In addition, in the 21st century, Norway has not led the medal list, either in golds, or total medals, at any Winter Olympics, except for golds in 2002. It would appear that both Germany and the United States are catching up.

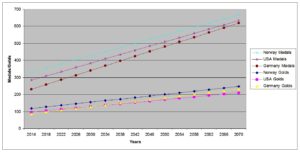
So are Norway’s days at the top of the Winter Olympics medal table numbered? We looked at the average number of golds and medals won at each Winter Olympics since 1992 by Norway, Germany, and the USA. We then predicted what would happen at the next few Winter Olympics, if all three nations continued to win medals at the same rate they have since 1992.

Here’s what the table looks like, going from 1992-2070:

[table]

Year,NOC,G,Meds,NOC,G,Meds,NOC,G,Meds

1992,NOR,63,188,USA,47,134,GER,25,63

1994,NOR,73,214,USA,53,147,GER,34,87

1998,NOR,83,239,USA,59,160,GER,46,116

2002,NOR,96,264,USA,69,194,GER,58,152

2006,NOR,98,283,USA,78,219,GER,69,181

2010,NOR,107,306,USA,87,256,GER,79,211

2014,NOR,118,332,USA,96,284,GER,87,230

2018,NOR,127,356,USA,104,309,GER,97,258

2022,NOR,136,380,USA,112,334,GER,108,286

2026,NOR,146,404,USA,121,359,GER,118,314

2030,NOR,155,428,USA,129,384,GER,128,341

2034,NOR,164,452,USA,137,409,GER,139,369

2038,NOR,173,476,USA,145,434,GER,149,397

2042,NOR,182,500,USA,153,459,GER,159,425

2046,NOR,191,524,USA,161,484,GER,170,453

2050,NOR,201,548,USA,170,509,GER,180,481

2054,NOR,210,572,USA,178,534,GER,190,508

2058,NOR,219,596,USA,186,559,GER,201,536

2062,NOR,228,620,USA,194,584,GER,211,564

2066,NOR,237,644,USA,202,609,GER,221,592

2070,NOR,246,668,USA,210,634,GER,232,620

[/table]

That’s a pretty busy table but here is what the chart of these projected medal tables look like:

As you can see in this chart, Norway starts out ahead in medals and gold medals, and stays ahead through 2070, although Germany and the United States both close the gaps slightly.

So will the USA or Germany topple Norway from the top of the Winter Olympic medal table? Not in my lifetime, and probably not in this century, unless things change.

Now it may be that they will change. The trend has been to add more and more X-generation and X-Games sports, such as freestyle skiing and snowboarding, and the United States has excelled at these sports. Germany not so much, but Germany is dominant in sliding sports. Unfortunately they’ve run out of them since we have sports going down the mountain sitting (bobsled), lying prone (skeleton), and lying supine (luge). I’m not sure how else they can slide down the mountain, unless they come up with a standing sliding event – ice surfing?

The above also assumes that the number of events on the Winter Olympics Program will remain about the same. The IOC has tended to add more and more events, but there are not many more Winter Olympic sports to add, and it’s hard to predict how these numbers may change if the number of events increases. It will depend on which events are added, whether they favor traditional winter events, favoring Norway, or they add X-sports, favoring the United States, and less so, Germany.

So for the foreseeable future, unless the Winter Olympic Program drastically changes, I think Norway will continue to lead the all-time Winter Olympic medal table through the 21st century.


2008-2012 Doping Re-Tests – An Update

In late November 2016 Hilary Evans (@OlyStatman) and I published a blog on this site about the IOC (International Olympic Committee) re-testing of the 2008-12 Olympic drug tests. In that blog, we noted that there were 104 positive tests for doping at those 2 Games, and gave details of which nations, which sports, and which drugs were involved. Please see https://olympstats.com/2016/11/28/summary-of-the-ioc-re-testing-from-2008-2012-to-date/ for the original summary.

Since that blog was published the re-testing has gone on, and the IOC has actually had six further releases in IOC News, announcing further sanctions. As a result, the 104 positive tests number is now only a memory, and today’s blog is to give a further update on the current status of the IOC re-tests from the 2008-12 Olympics.

As of 1 April 2017, there have now been 182 positive drug tests from the 2008 and 2012 Olympics, which includes the original positive tests and the positive re-tests over the previous 20 months or so. Of these, there were 81 positives from the 2008 Beijing Olympics, and 101 from the 2012 London Olympics. Of these 182 positives, 9 athletes tested positive at both the 2008 and 2012 Olympics, so there have been 173 athletes sanctioned. The 9 doping Grand Slam winners are as follows, with Ilyin losing 2 gold medals and Ostapchuk losing a gold and a bronze:

[table]

Name,Gender,NOC,Sport

Andrey Mikhnevich,M,BLR,ATH

Hripsime Khurshudyan,F,ARM,WLT

Ilya Ilyin,M,KAZ,WLT

İntiqam Zairov,M,AZE,WLT

Irina Kulesha,F,BLR,WLT

Ivan Tikhon,M,BLR,ATH

Maiya Maneza,F,KAZ,WLT

Nadezhda Ostapchuk,F,BLR,ATH

Oksana Menkova,F,BLR,ATH

[/table]

In the above, you will note that 5 athletes were from Belarus and 2 from Kazakhstan. Of the 182 sanctions given, the national breakdown is as follows:

[table]

NOC,###

Russia,48

Belarus,23

Ukraine,18

Turkey,14

Kazakhstan,12

Azerbaijan,6

Moldova,5

Armenia,4

China,4

Greece,4

Brazil,3

Spain,3

Germany,3

United States,3

Colombia,2

Cuba,2

Italy,2

Saudi Arabia,2

Morocco,2

Norway,2

Qatar,2

Uzbekistan,2

Albania,1

Bahrain,1

Bulgaria,1

Croatia,1

Cyprus,1

France,1

Georgia,1

Ireland,1

Jamaica,1

Poland,1

DPR Korea (North),1

Saint Kitts and Nevis,1

Slovenia,1

Syria,1

Trinidad & Tobago,1

Vietnam,1

Total,182

[/table]

Of these, 65.4% are from former Soviet nations. While quite high, that is better than in the 28 November 2016 blog, when, of the 104 positive tests, 82.7% came from former Soviet nations.

The breakdown by sport is as follows:

[table]

Sport,###

Athletics,103

Weightlifting,50

Equestrian Events,7

Cycling,6

Wrestling,6

Gymnastics,2

Shooting,2

Boxing,1

Canoeing,1

Judo,1

Modern Pentathlon,1

Rowing,1

Swimming,1

Total,182

[/table]

Here, athletics (track & field) accounts for 56.6% of the positive tests, while athletics and weightlifting together comprise 84.1% of all the positive tests. It should be noted that the equestrian positives involve doping of the horses, in most cases with capsaicin, a topical anti-inflammatory medication derived from chili peppers.

As to what the athletes are taking, the trend is the same as back in November 2016 with the three biggest offenders being turinabol (dehydrochloromethyltestosterone), stanozolol (7β-Hydroxy-17α-methyl-5α-androstano[3,2-c]pyrazole), both of which are anabolic steroids, and biological passport offenses. The breakdown by drugs is given in the following table. Note that the total comes to well over 182 (222) because many athletes tested positive for 2 or more drugs.

[table]

Drug,###

Turinabol,78

Stanozolol,42

Biologic passport offense,32

Oxandrolone,9

Erythropoietin,7

Capsaicin,6

Furosemide,4

Methylhexanamine,4

Methyltrienolone,4

Testosterone,4

CERA re-test +,3

Clenbuterol,3

Unknown,3

Acetazolamide,2

CERA,2

Drostanolone,2

GHRP-2 & GHRP-2 M2,2

Blast-Off Red,1

Blood doping,1

Felbinac,1

GHRP-2,1

Ipamorelin,1

Marijuana,1

Methandienone,1

Methyltestosterone,1

Nandrolone,1

Other anabolic steroid,1

Propranolol,1

Sample tampering,1

Sibutamine,1

Total,222

[/table]

Please refer again to our previous blog (https://olympstats.com/2016/11/28/summary-of-the-ioc-re-testing-from-2008-2012-to-date/) in which I gave details of exactly what the above drugs were and what they are purported to do. In addition, the legend to the final table in this blog gives brief information on each drug.

As noted in that previous blog, it is very difficult to give full details about medals lost and medals won by nations. In doping sanctions, the results are changed by the International Federations (IFs), while the medals are removed and re-allocated by the IOC. Thus we can provide good information about medals lost, but re-allocation of medals can be a slow process because of appeals to the CAS (Court of Arbitration for Sport) and further legal appeals. Because of the legal risks involved, the IOC moves slowly in re-allocation of medals.

As I noted in some recent tweets, however, re-allocation of Olympic medals is not a given. The classic case in 2008-12 has occurred in the 2012 men’s 94 kg weightlifting event, in which 6 of the top 8 finishers, including the top 4 finishers, all tested positive. Theoretically, the 9th place finisher, Tomasz Zielinski of Poland, could move up to a bronze medal. However, as of 1 April, the IOC has re-allocated the gold and silver medals (to Saeid Mohammadpourkarkaragh of Iran and Kim Min-Jae of Korea, respectively), but has not re-allocated the bronze medal, likely because Zielinski had a doping positive in Rio for spironolactone.

However, as of 1 April 2017, 74 medals have been lost for doping positives in 2008-12, with 18 gold medals removed. The breakdown is as follows, with the detailed breakdown first, followed by tables listing medals lost by sports and nations:

[table]

NOC,Sport,Year,G,S,B,TM

Armenia,Weightlifting,2008,0,0,1,1

Azerbaijan,Wrestling,2008,0,1,0,1

Belarus,Athletics,2008,1,2,3,6

Belarus,Weightlifting,2008,0,1,1,2

Brazil,Equestrian Events,2008,0,0,1,1

Bahrain,Athletics,2008,1,0,0,1

China,Weightlifting,2008,3,0,0,3

Cuba,Athletics,2008,0,1,0,1

Greece,Athletics,2008,0,0,1,1

Italy,Cycling,2008,0,1,0,1

Jamaica,Athletics,2008,1,0,0,1

Kazakhstan,Weightlifting,2008,1,1,1,3

Kazakhstan,Wrestling,2008,0,0,1,1

Norway,Equestrian Events,2008,0,0,1,1

DPR Korea (North),Shooting,2008,0,1,1,2

Russia,Athletics,2008,0,4,2,6

Russia,Weightlifting,2008,0,1,3,4

Russia,Wrestling,2008,0,1,0,1

Turkey,Athletics,2008,0,1,0,1

Turkey,Weightlifting,2008,0,1,0,1

Ukraine,Athletics,2008,0,1,1,2

Ukraine,Modern Pentathlon,2008,0,0,1,1

Ukraine,Weightlifting,2008,0,1,1,2

,Totals,2008,7,18,19,44

Armenia,Weightlifting,2012,0,0,1,1

Belarus,Athletics,2012,1,0,0,1

Belarus,Weightlifting,2012,0,0,2,2

Kazakhstan,Weightlifting,2012,4,0,0,4

Moldova,Weightlifting,2012,0,0,2,2

Russia,Athletics,2012,4,4,1,9

Russia,Weightlifting,2012,0,4,0,4

Russia,Wrestling,2012,0,1,0,1

Turkey,Athletics,2012,2,0,0,2

Ukraine,Athletics,2012,0,1,0,1

Ukraine,Weightlifting,2012,0,0,1,1

United States,Athletics,2012,0,1,0,1

Uzbekistan,Wrestling,2012,0,0,1,1

,Totals,2012,11,11,8,30

,Overal Totals,,18,29,27,74

[/table]

[table]

Sport,G,S,B,TM

Athletics,10,15,8,33

Weightlifting,8,9,13,30

Wrestling,0,3,2,5

Shooting,0,1,1,2

Equestrian Events,0,0,2,2

Cycling,0,1,0,1

Modern Pentathlon,0,0,1,1

Totals,18,29,27,74

[/table]

[table]

NOC,G,S,B,TM

Russia,4,15,6,25

Belarus,2,3,6,11

Kazakhstan,5,1,2,8

Ukraine,0,3,4,7

Turkey,2,2,0,4

China,3,0,0,3

DPR Korea (North),0,1,1,2

Armenia,0,0,2,2

Moldova,0,0,2,2

Bahrain,1,0,0,1

Jamaica,1,0,0,1

Azerbaijan,0,1,0,1

Cuba,0,1,0,1

Italy,0,1,0,1

United States,0,1,0,1

Brazil,0,0,1,1

Greece,0,0,1,1

Norway,0,0,1,1

Uzbekistan,0,0,1,1

Total,18,29,27,74

[/table]

For completeness, at the end of this blog, we will list all 182 positive tests to date, which also details medals removed, sorted, in order, by year, nation, sport, and gender.

I will also repeat a paragraph from the November 2016: “These athletes did break the rules and this certainly looks terrible, but it’s important to remember one thing about this. The IOC tries to catch the drug cheats, more so than in most professional sports, notably in the four major pro sports in the United States (although baseball has gotten much better in recent years). Further, the WADA penalties are far more punitive than those in US professional sports, especially the NFL where a positive drug test costs you 4 games, or ¼th of a season, versus 2 calendar years or more in Olympic sports. It is easy to criticize the IOC for this plethora of positive tests, but one should also note that they took the trouble to do the re-testing, something we will almost never see from the NFL or other professional sports.”

So, in summary, the numbers have significantly increased since our last report on this in November 2016, however, the trends are similar. The most affected sports have been athletics and weightlifting, by far, and the nations involved have tended to be former Soviet nations, led by Russia, Belarus, and the Ukraine. The testing is ongoing, so watch this space.

[table]

Name,Gdr,NOC,Sport,Year,Events,Places,Medal,Violations

Hripsime Khurshudyan,F,ARM,WLT,2008,75kg,11,,Stan

Tigran G. Martirosyan,M,ARM,WLT,2008,69kg,3,B,Turin; Stan

Sərdar Həsənov,M,AZE,WLT,2008,62kg,DNF,,Turin

Nizami Paşayev,M,AZE,WLT,2008,94kg,5,,Turin; Oxan; Stan

İntiqam Zairov,M,AZE,WLT,2008,85kg,9,,Turin

Vitaliy Rəhimov,M,AZE,WRE,2008,60kgGR,2,S,Turin

Nataliya Kh’enko-Mi’vich,F,BLR,ATH,2008,SP,2,S,Meth; Stan

Oksana Menkova,F,BLR,ATH,2008,HT,1,G,Turin; Oxan

Nadezhda Ostapchuk,F,BLR,ATH,2008,SP,3,B,Turin; Stan

Darya Pchelnik,F,BLR,ATH,2008,HT,4,,Turin

Svetlana Usovich,F,BLR,ATH,2008,800m/4×400,r2 / 4,,Turin

Irina Kulesha,F,BLR,WLT,2008,75kg,4,,Turin

Anastasiya Novikova,F,BLR,WLT,2008,53kg,3,B,Turin; Stan

Vadim Devyatovsky,M,BLR,ATH,2008,HT,2,S,Testo

Pavel Lyzhin,M,BLR,ATH,2008,SP,4,,Turin

Andrey Mikhnevich,M,BLR,ATH,2008,SP,3,B,Clen; Meth; Oxan

Ivan Tikhon,M,BLR,ATH,2008,HT,3,B,Testo

Andrey Rybakov,M,BLR,WLT,2008,83kg,2,S,Turin; Stan

Rodrigo Pessoa,M,BRA,EQU,2008,Jump/Team,=27 / 10,,Capsaicin

Bernardo Resende,M,BRA,EQU,2008,Jump/Team,=3 / 10,B,Capsaicin

Rashid Ramzi,M,BRN,ATH,2008,1500m,1,G,CERA re-test +

Tezdzhan Naimova,F,BUL,ATH,2008,100m,Heats,,Sample tampering

Cao Lei,F,CHN,WLT,2008,75kg,1,G,GHRP-2 + M2

Chen Xiexia,F,CHN,WLT,2008,48kg,1,G,GHRP-2 + M2

Liu Chunhong,F,CHN,WLT,2008,69kg,1,G,Sibut; GHRP-2

Vanja Perišić,F,CRO,ATH,2008,800m,r1,,CERA re-test +

Yarelis Barrios,F,CUB,ATH,2008,DT,2,S,Acetazolamide.

Wilfredo Martínez,M,CUB,ATH,2008,LJ,5,,Acetazolamide.

Alissa Kallinikou,F,CYP,ATH,2008,400m,5 h7 r1/3,,Testo

Josephine Onyia,F,ESP,ATH,2008,100HH,r2/3,,MHX

Maribel Moreno,F,ESP,CYC,2008,Non-competitor,DNS,,EPO

Stefan Schumacher,M,GER,CYC,2008,ITT/Road race,13 / DNF,,CERA

Christian Ahlmann,M,GER,EQU,2008,Jump/Team,=28 / 8,,Capsaicin

Marco Kutscher,M,GER,EQU,2008,Jump/Team,38 /8,,Capsaicin

Pigi Devetzi,F,GRE,ATH,2008,LJ/TJ,14 / 3,B,Stan

Fani Khalkia,F,GRE,ATH,2008,Non-competitor,DNS,,MTri

Athanasia Tsoumeleka,F,GRE,ATH,2008,20K wk,9,,CERA re-test +

Tasos Gousis,M,GRE,ATH,2008,Non-competitor,DNS,,MTri

Denis Lynch,M,IRL,EQU,2008,Jumping,=8,,Capsaicin

Davide Rebellin,M,ITA,CYC,2008,Road race,2,S,CERA

Nesta Carter,M,JAM,ATH,2008,4×100,1,G,MHX

Mariya Grabovetskaya,F,KAZ,WLT,2008,+75kg,3,B,Turin; Oxan; Stan

Maiya Maneza,F,KAZ,WLT,2008,63kg,DNS,,Stan

Irina Nekrasova,F,KAZ,WLT,2008,63kg,2,S,Stan

Ilya Ilyin,M,KAZ,WLT,2008,94 kg,1,G,Stan

Vladimir Sedov,M,KAZ,WLT,2008,85kg,4,,Stan

Aset Mambetov,M,KAZ,WRE,2008,96kgGR,3,B,Stan

Alexandru Dudoglo,M,MDA,WLT,2008,69kg,9,,Stan

Tony André Hansen,M,NOR,EQU,2008,Jump/Team,1QR / 3,B,Capsaicin

Adam Seroczyński,M,POL,CAN,2008,K2-1000,4,,Clen

Kim Jong-Su,M,PRK,SHO,2008,AP/FP,3 / 2,B/S,Propran

Samuel Francis,M,QAT,ATH,2008,100m,r3,,Stan

Mariya Abakumova,F,RUS,ATH,2008,JT,2,S,Turin

Inga Abitova,F,RUS,ATH,2008,10K,6,,Turin

Yuliya Chermo’skaya,F,RUS,ATH,2008,200m/4×100,r3 / 1,,Turin; Stan

Anna Chicherova,F,RUS,ATH,2008,HJ,3,B,Turin

Tatyana Firova,F,RUS,ATH,2008,400m/4×400,6 / 2,S,Turin; other AS

Anast. Kapa’skaya,F,RUS,ATH,2008,400m/4×400,5 / 2,S,Turin; Stan

Tatyana Lebedeva,F,RUS,ATH,2008,LJ/TJ,2 / 2,S,Turin

Yelena Slesarenko,F,RUS,ATH,2008,HJ,4,,Turin

Yekaterina Volkova,F,RUS,ATH,2008,Steeple,3,B,Turin

Marina Shainova,F,RUS,WLT,2008,58kg,2,S,Turin; Stan

Nadezhda Yevstyukhina,F,RUS,WLT,2008,75kg,3,B,Turin; EPO

Denis Alekseyev,M,RUS,ATH,2008,400m/4×400,r1 / 3,,Turin

Aleksandr Pogorelov,M,RUS,ATH,2008,Decathlon,4,,Turin

Ivan Yushkov,M,RUS,ATH,2008,SP,10,,Turin; Oxan; Stan

Khadzhimurat Akkayev,M,RUS,WLT,2008,94kg,3,B,Turin

Dmitry Lapikov,M,RUS,WLT,2008,105kg,3,B,Turin

Khasan Baroyev,M,RUS,WRE,2008,120kgGR,2,S,Turin

Elvan Abeylegesse,F,TUR,ATH,2008,5K,2,S,Stan

Sibel Özkan,F,TUR,WLT,2008,48kg,2,S,Stan

Nurcan Taylan,F,TUR,WLT,2008,48kg,DNF,,Stan

Liudmyla Blonska,F,UKR,ATH,2008,LJ/Hept,3QR / 2,S,MTS

Vita Palamar,F,UKR,ATH,2008,HJ,5,,Turin

Viktoriya Tereshchuk,F,UKR,MOP,2008,Individual,3,B,Turin

Nataliya Davydova,F,UKR,WLT,2008,69kg,3,B,Turin

Olha Korobka,F,UKR,WLT,2008,+75kg,2,S,Turin

Denys Yurchenko,M,UKR,ATH,2008,PV,3,B,Turin

Ihor Razoronov,M,UKR,WLT,2008,105 kg,6,,Nandro

Courtney King-Dye,F,USA,EQU,2008,Dress/Team,13 / 4,,Felbinac

Thị Ngân Thương Đỗ,F,VIE,GYM,2008,All-Around +4Apps,59,,Lasix

Hysen Pulaku,M,ALB,WLT,2012,77 kg.,DNS,,Stan

Hripsime Khurshudyan,F,ARM,WLT,2012,+75kg,3,B,Turin; Stan

Norayr Vardanyan,M,ARM,WLT,2012,94kg,11,,Turin

Boyanka Kostova,F,AZE,WLT,2012,58kg,5,,Turin; Stan

İntiqam Zairov,M,AZE,WLT,2012,94kg,6,,Turin

Anastasiya Ivanova-Shvedova,F,BLR,ATH,2012,PV,17,,Turin

Nataliya Koreyvo,F,BLR,ATH,2012,1500m,7,,BPO

Oksana Menkova,F,BLR,ATH,2012,HT,7,,Turin; Stan

Nadezhda Ostapchuk,F,BLR,ATH,2012,SP,1,G,Methen

Irina Kulesha,F,BLR,WLT,2012,75kg,3,B,Turin

Dina Sazanovets,F,BLR,WLT,2012,69kg,4,,Drost; Stan

Marina Shkermankova,F,BLR,WLT,2012,69kg,3,B,Turin; Stan

Pavel Kryvitsky,M,BLR,ATH,2012,HT,28,,Turin; Stan

Andrey Mikhnevich,M,BLR,ATH,2012,SP,17QR,,Clen; Meth; Oxan

Ivan Tikhon,M,BLR,ATH,2012,Pre-games test,DNS,,Meth

Yevgeny Zhernosek,M,BLR,WLT,2012,+105kg,9,,Turin; Oxan; Stan

Kissya Costa,F,BRA,ROW,2012,Single sculls,18,,EPO

Wang Jianan,F,CHN,ATH,2012,Marathon,58,,BPO

Yolanda Caballero,F,COL,ATH,2012,Marathon,DNF,,BPO

Diego Palomegue,M,COL,ATH,2012,Pre-games testing,DNS,,Stan

Marta Domínguez,F,ESP,ATH,2012,Steeple,12,,BPO

Hassan Hirt,M,FRA,ATH,2012,5K,11h1 r1/2,,EPO

Raul Tsirek’idze,M,GEO,WLT,2012,85kg,9,,Turin; Stan

Alex Schwazer,M,ITA,ATH,2012,Pre-games test,DNS,,EPO

Zulfiya Chinshanlo,F,KAZ,WLT,2012,53kg,1,G,Oxan; Stan

Maiya Maneza,F,KAZ,WLT,2012,63kg,1,G,Stan

Svetlana Podobedova,F,KAZ,WLT,2012,75kg,1,G,Stan

Ilya Ilyin,M,KAZ,WLT,2012,94kg,1,G,Turin; Stan

Almas Uteshov,M,KAZ,WLT,2012,94kg,7,,Turin; Stan

Taymuraz Tigiyev,M,KAZ,WRE,2012,94kgFS,=14,,Turin

Hussain Al-Hamdah,M,KSA,ATH,2012,5K,19r1/2,,BPO

Mohammed Shaween,M,KSA,ATH,2012,1500m,Semis,,BPO

Amine Laâlou,F,MAR,ATH,2012,Pre-games test,DNS,,Lasix

Abderrahhime Bouramdane,M,MAR,ATH,2012,Marathon,DNF,,BPO

Zalina Marghiev,F,MDA,ATH,2012,Hammer,8,,Turin; Stan

Marina Marghiyev,F,MDA,ATH,2012,Pre-games test,DNS,,Lasix

Cristina Iovu,F,MDA,WLT,2012,53kg,3,B,Turin

Anatolii Cîrîcu,M,MDA,WLT,2012,94kg,3,B,Turin

Hamza Driouch,M,QAT,ATH,2012,1500m,10r2,,BPO

Yelena Arzhakova,F,RUS,ATH,2012,800m,6,,BPO

Mariya Bespalova,F,RUS,ATH,2012,HT,8,,Unknown

Tatyana Chernova,F,RUS,ATH,2012,Heptathlon,3,B,Turin

Vera Ganeyeva,F,RUS,ATH,2012,DT,23 QR,,Turin

Yelizaveta Grechishnikova,F,RUS,ATH,2012,10K,19r1,,BPO

Olga Kaniskina,F,RUS,ATH,2012,20K wk,2,S,BPO

Gulfiya Khanafeyeva,F,RUS,ATH,2012,HT,13,,Turin

Yevgeniya Kolodko,F,RUS,ATH,2012,SP,2,S,Turin; Ipamo

Yekaterina Kostetskaya,F,RUS,ATH,2012,1500m,9,,BPO

Antonina Krivoshapka,F,RUS,ATH,2012,400m/4×400,6 / 2,S,Turin

Tatyana Lysenko,F,RUS,ATH,2012,HT,1,G,Unknown

Yekaterina Martynova,F,RUS,ATH,2012,1500m,r1/3,,BPO

Darya Pishchalnikova,F,RUS,ATH,2012,DT,2,S,Oxan

Mariya Savinova,F,RUS,ATH,2012,800m,1,G,BPO

Viktoriya Valyukovich,F,RUS,ATH,2012,TJ,8,,Turin

Yuliya Zaripova,F,RUS,ATH,2012,Steeple,1,G,Turin

Viktoriya Baranova,F,RUS,CYC,2012,Pre-games testing,DNS,,Testo

Yekaterina Gnidenko,F,RUS,CYC,2012,Kieren/Sprint,8 / 18,,Turin

Svetlana Tsarukayeva,F,RUS,WLT,2012,63kg,2,S,Turin

Nataliya Zabolotnaya,F,RUS,WLT,2012,75kg,2,S,Turin

Sergey Bakulin,M,RUS,ATH,2012,50K wk,5,,BPO

Valeriy Borchin,M,RUS,ATH,2012,20K wk,DNF,,BPO

Kirill Ikonnikov,M,RUS,ATH,2012,HT,5,,Turin

Vladimir Kanaykin,M,RUS,ATH,2012,20K wk,DNF,,BPO

Sergey Kirdyapkin,M,RUS,ATH,2012,50K wk,1,G,BPO

Dmitry Starodubtsev,M,RUS,ATH,2012,PV,4,,Turin

Igor Yerokhin,M,RUS,ATH,2012,50K wk,5,,BPO

Apti Aukhadov,M,RUS,WLT,2012,85kg,2,S,Turin; Drost

Andrey Demanov,M,RUS,WLT,2012,94kg,4,,Turin

Aleksandr Ivanov,M,RUS,WLT,2012,94kg,2,S,Turin; Stan

Besik Kudukhov,M,RUS,WRE,2012,60kgFS,2,S,Turin

Tameka Williams,F,SKN,ATH,2012,100m/200m,DNS,,Blast-Off Red

Blaža Klemenčič,F,SLO,CYC,2012,MTB,23,,EPO

Ghfran Mouhamad,F,SYR,ATH,2012,400IH,8 h2 r1/3,,MHX

Semoy Hackett,F,TTO,ATH,2012,100m/200m/4×100,Hts / 8 / Final,,MHX

Aslı Çakır,F,TUR,ATH,2012,1500m,1,G,BPO

Gamze Bulut,F,TUR,ATH,2012,1500m,2,G,BPO

Bahar Doğan,F,TUR,ATH,2012,Marathon,62,,BPO

Ümmü Kiraz,F,TUR,ATH,2012,Marathon,88,,BPO

Semiha Mutlu,F,TUR,ATH,2012,20K wk,47,,BPO

Meliz Redif,F,TUR,ATH,2012,4×400,r1,,BPO

Pınar Saka,F,TUR,ATH,2012,400m/4×400,4r1/3 / 8r1/2,,BPO

Binnaz Uslu,F,TUR,ATH,2012,Steeple,15r1,,BPO

Nevin Yanıt,F,TUR,ATH,2012,100HH,5,,Blood doping

Sibel Şimşek,F,TUR,WLT,2012,63kg,4,,Turin; Stan

Adem Kılıççı,M,TUR,BOX,2012,75 kg.,=5,,Turin

Tetiana Hamera-Shmyrko,F,UKR,ATH,2012,Marathon,5,,BPO

Liudmyla Iosypenko,F,UKR,ATH,2012,Heptathlon,4,,BPO

Hanna Mishchenko,F,UKR,ATH,2012,1500m,r1,,BPO

Anzhelika Shevchenko,F,UKR,ATH,2012,1500m,13r1/3,,BPO

Svitlana Shmidt,F,UKR,ATH,2012,Steeple,12h3r1/2,,BPO

Marharyta Tverdokhlib,F,UKR,ATH,2012,LJ,25,,Turin; Stan

Olha Beresneva,F,UKR,SWI,2012,10k OW,7,,EPO

Yuliya Kalina,F,UKR,WLT,2012,58kg,3,B,Turin

Oleksandr Dryhol,M,UKR,ATH,2012,HT,34,,Turin

Maksym Mazuryk,M,UKR,ATH,2012,PV,18,,Turin

Oleksandr P’iatnytsia,M,UKR,ATH,2012,JT,2,S,Turin

Tyson Gay,M,USA,ATH,2012,100m/4×100,4 / 2,S,Unknown

Nick Delpopolo,M,USA,JUD,2012,Lightweight,=7,,Marijuana

Luiza Galiulina,F,UZB,GYM,2012,All-Around,DNS,,Lasix

Soslan Tigiyev,M,UZB,WRE,2012,74kgFS,3,B,Turin

[/table]

Table Legend for Violations: BPO = Biological passport offense; CERA = continuous erythropoietin receptor activator (increases red blood cell counts); Clen = Clenbuterol (sympathomimetic anabolic agent); Drost = Drostolone (anabolic steroid); EPO = Erythropoietin (increases red blood cell counts); GHRP-2 = growth hormone releasing peptide (pralmorelin) (increases growth hormone levels); Ipamo = Ipamorelin (GHRP analogue; increases growth hormone levels); Lasix = Furosemide (diuretic); Meth = Methandienone (anabolic steroid); Methen = Methenolone (anabolic steroid); MHX = Methylhexanamine (sympathomimetic amine = stimulant); MTri = Methyltrienolone (anabolic steroid); MTS = Methyltestosterone (anabolic steroid); Nandro = Nandrolone (anabolic steroid); Other AS (anabolic steroid) = 3a-hydroxy-5a-androst-1-en-17-one (anabolic steroid); Oxan = Oxandrolone (anabolic steroid); Propran = Propranolol (ß-blocker, slows heart rate, may increase cardiac output); Sibut = Sibutramine (oral anorexic; helps lose weight); Stan = Stanozolol (anabolic steroid); Testo = Testosterone (anabolic steroid); Turin = Turinabol (anabolic steroid).

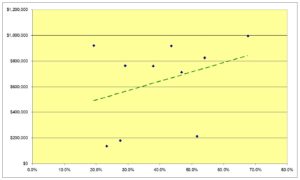
Olympic Basketball Multi-Gold Medalists

Bill Hougland died yesterday. Even to die-hard Olympic fans that is not a well-known name, but Hougland played basketball at the University of Kansas and won gold medals in basketball at the 1952 and 1956 Olympics. An AP story and obituary called him the first Olympian to win 2 gold medals in basketball but that was wrong. The first was Bob Kurland, who won gold medals for the US in 1948 and 1952.

Prior to NBA players being allowed to play in the Olympics, only 3 US Olympians won 2 gold medals in basketball – Kurland, Hougland, and Burdie Halldorson, who played in 1956 and 1960.

Of the multiple Olympic hoops gold medalists, there are 8 Soviet women from 1976-80, but all the others are American, as would be expected, given the US dominance in the sport. Here are the lists of Olympic basketball players to win multiple gold medals – first the men and then the women:

[table]

Name,Gdr,NOC,Sport,Golds,Years

Carmelo Anthony,M,USA,BAS,3,2008/2012/2016

Bob Kurland,M,USA,BAS,2,1948/1952

Bill Hougland,M,USA,BAS,2,1952/1956

Burdie Haldorson,M,USA,BAS,2,1956/1960

Patrick Ewing,M,USA,BAS,2,1984/1992

Michael Jordan,M,USA,BAS,2,1984/1992

Chris Mullin,M,USA,BAS,2,1984/1992

David Robinson,M,USA,BAS,2,1992/1996

Charles Barkley,M,USA,BAS,2,1992/1996

Karl Malone,M,USA,BAS,2,1992/1996

Scottie Pippen,M,USA,BAS,2,1992/1996

John Stockton,M,USA,BAS,2,1992/1996

Gary Payton,M,USA,BAS,2,1996/2000

Jason Kidd,M,USA,BAS,2,2000/2008

LeBron James,M,USA,BAS,2,2008/2012

Kobe Bryant,M,USA,BAS,2,2008/2012

Chris Paul,M,USA,BAS,2,2008/2012

Deron Williams,M,USA,BAS,2,2008/2012

[/table]

[table]

Name,Gdr,NOC,Sport,Golds,Years

Teresa Edwards,F,USA,BAS,4,1984/1988/1996/2000

Lisa Leslie,F,USA,BAS,4,1996/2000/2004/2008

Sue Bird,F,USA,BAS,4,2004/2008/2012/2016

Tamika Catchings,F,USA,BAS,4,2004/2008/2012/2016

Diana Taurasi,F,USA,BAS,4,2004/2008/2012/2016

Dawn Staley,F,USA,BAS,3,1996/2000/2004

Sheryl Swoopes,F,USA,BAS,3,1996/2000/2004

Katie Smith,F,USA,BAS,3,2000/2004/2008

Seimone Augustus,F,USA,BAS,3,2008/2012/2016

Olga Barysheva-Korostelyova,F,URS,BAS,2,1976/1980

Nelli Feryabnikova,F,URS,BAS,2,1976/1980

Tatyana Ovechkina,F,URS,BAS,2,1976/1980

Angelė Rupšienė,F,URS,BAS,2,1976/1980

Uļjana Semjonova,F,URS,BAS,2,1976/1980

Nadezhda Shuvayeva-Olkhova,F,URS,BAS,2,1976/1980

Olga Sukharnova,F,URS,BAS,2,1976/1980

Tetiana Zakharova-Nadyrova,F,URS,BAS,2,1976/1980

Anne Donovan,F,USA,BAS,2,1984/1988

Katrina McClain,F,USA,BAS,2,1988/1996

Ruthie Bolton-Holifield,F,USA,BAS,2,1996/2000

Nikki McCray,F,USA,BAS,2,1996/2000

Yolanda Griffith,F,USA,BAS,2,2000/2004

DeLisha Milton-Jones,F,USA,BAS,2,2000/2008

Tina Thompson,F,USA,BAS,2,2004/2008

Swin Cash,F,USA,BAS,2,2004/2012

Sylvia Fowles,F,USA,BAS,2,2008/2012

Candace Parker,F,USA,BAS,2,2008/2012

[/table]

All the Olympic Stats You'll Ever Need