All posts by bmallon

Sochi 2014 – Winter Sports Factsheets

Over the next week or so, we will be providing factsheets on the 15 Winter Olympic Sports / Disciplines. These will include all the data you’ll ever need to know concerning what has happened at the Winter Olympics previously in these sports. We’ll start with a short background on the sport, followed by multiple statistical files that will be attached as a PDF file for your use – they need to be in PDF files because of their complexity in terms of statistical tables and such.

After we finish with the Winter Olympic Sports / Disciplines, we’ll then provide a series of similar factsheets for the Nations that will be competing at Sochi, or that have competed before at the Winter Olympics.

Finally, our final factsheets in the run-up to Sochi will be a General Overview of the Olympic Winter Games. Hope you enjoy. Let us know if there is something else you want to see that we’ve missed. – Bill Mallon

Summer / Winter Olympic Sports Doubles

Simply making an Olympic team is often considered among the ultimate athletic accomplishments. It signifies that you have reached the highest level of competition in your sport. But in some cases athletes have competed at both the Summer and Winter Olympics, which has to be an even rarer feat. How common is it?

Actually, it has happened 128 times. And it has been done in a dizzying array of 47 different sport combinations. By far the most common both season Olympians are in athletics (track & field) and bobsledding, with 40 Olympians competing in this combination.

The first to do that was the Belgian Max Houben,  who competed in athletics in 1920 and bobsledding in 1928-48. He was followed by Austrian Johann Baptist Gudenus, a 1932-36 bobsledder and Olympian in athletics in 1936. There was then a large gap before this occurred again, with Britain Colin Campbell (1968/72 ATH, 1976 BOB), and Swiss Edy Hubacher (1968 ATH, 1972 BOB).

In 1980 at Lake Placid Willie Davenport competed in bobsledding for the United States. A four-time Olympian (1964-76), and gold medalist in the high hurdles in 1968, Davenport was recruited to bobsledding for his leg strength and drive, to help with the push starts. It began a trend of top track & field athletes competing in bobsled. The best known was likely East German 1988 decathlon silver medalist Torsten Voss, who pushed a bob at Nagano in 1998 for Germany.

From the United States, another famous athlete who competed in Olympic bobsledding (1992) was NFL running back Herschel Walker. Walker was a top track & field in high school but never competed in the Summer Olympics.

Multiple athletics stars have been recruited since, with the United States possibly including Lolo Jones and Lauryn Williams on their women’s bobsled squads for Sochi.

Prior to this trend of athletics/bobsledding doubles, the most common both season sport double was cycling and speedskating, and it is still the second most common with 16 athletes having accomplished it. This combination occurred because the muscles and the training for both sports is similar, and athletes would often use the “other” sport for off-season training.

Two cyclists / speedskaters have won Olympic medals in both sports – Canadian Clara Hughes and German Christa Rothenburger-Luding. No athlete / bobsledder has yet pulled off the Winter / Summer medal double. This has been done by other athletes – notably Eddie Eagan, an American who won a gold medal in 1920 boxing and 1932 bobsledding, the only Olympian to have won gold medals at both the Winter and Summer Olympics. Norwegian Jacob Tullin Thams won Olympic medals in both ski jumping and sailing – there’s a combination for you.

It was even rarer for athletes to compete in the Summer and Winter Olympics in the same year, although that can no longer occur. This was done 41 times. Most notable was the accomplishment of Japanese female cyclist / speedskater Seiko Hashimoto who competed at the Winter and Summer Olympics in 1988 and 1992. The only other Olympian to have done this twice was the Swiss Charles Stoffel, who, in the days of more gentlemanly bobsled competition, competed in equestrian and bobsledding in 1924 and 1928.

Here are the sport doubles for both season Olympians, in order of frequency:

Summer                               Winter                                                                         ###

Athletics                              Bobsledding                                                                40

Cycling                                 Speedskating                                                              16

Cycling                                 Cross-Country Skiing                                               9

Hockey                                 Ice Hockey                                                                      7

Athletics                             Cross-Country Skiing                                               4

Football                               Ice Hockey                                                                      4

Athletics                             Cross-Country Skiing / Nordic Combined   3

Cycling                                 Short-Track Speedskating                                     2

Equestrian Events         Bobsledding                                                                   2

Hockey                                 Bobsledding                                                                   2

Rowing                                 Bobsledding                                                                   2

Sailing                                   Ice Hockey                                                                      2

Athletics                             Biathlon                                                                            1

Athletics                             Figure Skating                                                               1

Athletics                             Ice Hockey                                                                      1

Boxing                                 Bobsledding                                                                    1

Canoeing                           Cross-Country Skiing                                                1

Canoeing                           Luge                                                                                     1

Cycling                                Biathlon / Cross-Country Skiing                        1

Cycling                               Bobsledding                                                                     1

Fencing                              Bobsledding                                                                     1

Fencing                              Ice Hockey                                                                        1

Football                             Bobsledding                                                                     1

Handball                           Alpine Skiing / Cross-Country Skiing                1

Judo                                    Bobsledding                                                                      1

Modern Pentathlon   Cross-Country Skiing                                                 1

Modern Pentathlon   Military Ski Patrol                                                        1

Modern Pentathlon   Nordic Combined                                                         1

Modern Pentathlon   Speedskating                                                                   1

Rowing                               Cross-Country Skiing                                                1

Rowing                               Ice Hockey                                                                        1

Rowing                               Ice Hockey / Speedskating                                      1

Rowing                               Luge                                                                                      1

Rowing                               Military Ski Patrol                                                        1

Rowing                               Speedskating                                                                   1

Sailing                                 Alpine Skiing                                                                    1

Sailing                                 Bobsledding                                                                     1

Sailing                                 Ski Jumping                                                                       1

Shooting                            Biathlon                                                                              1

Shooting                            Figure Skating                                                                 1

Softball                               Ice Hockey                                                                       1

Swimming                         Bobsledding                                                                    1

Swimming                         Figure Skating                                                                1

Swimming                         Ski Jumping                                                                      1

Water Polo                       Bobsledding                                                                     1

Weightlifting                  Bobsledding                                                                      1

Wrestling                          Bobsledding                                                                     1

Totals                                                                                                                               128

How many will add to this list in Sochi? Certainly there will be a few athlete / bobsledders. Anybody else?


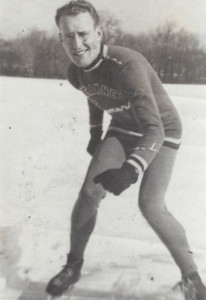
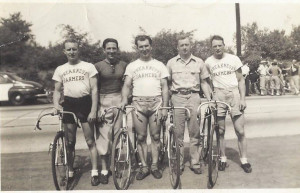
(Note: the author has a personal connection here – see the photos below of the cyclist / speedskater (guy on the left in the cycling picture). That guy went to the US Olympic Trials in cycling and speedskating in 1948, but did not make either Olympic team. That guy, however, was an Olympian of a Dad. And that folks, for your information, is how I first became interested in the Olympic Games.)

Dad Skating

Dad Cycling

(Note: tomorrow we will start providing factsheets for the 15 Winter Olympic sports to be held in Sochi. Stay tuned.)

Olympic Ski Jumping Hills

From 1924-60 there was one ski jumping event held at the Winter Olympics, termed the normal hill event. In 1964 a second competition on the large hill was added. In 1988 a team event on the large event became the third Olympic ski jumping event. Women will compete in ski jumping at the Olympics for the first time at Sochi in 2014, jumping off the normal hill.

But “normal” hill and “large” hill are not fixed definitions. The hills have varied significantly over the years and the hills have continued to get larger over time. The design of a ski jumping hill is complex with numerous tables and charts defining the mathematical analysis available in multiple sources.

Ski jumping hills are often defined by what is known as the K-point (for K/critical, or construction, point). Currently, a normal hill has a K-point of about 90 metres, while a large hill K-point is usually about 120 metres. But as you can see below, the last two Winter Olympics, and Sochi, have had slightly larger hills, at 95 and 125 metres, respectively.

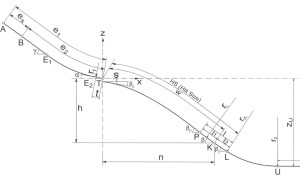
The K-point defines the average point on the landing hill where the jumpers are expected to land, for maximum safety. It can actually be defined as the inflection point where the landing hill curvature changes from convex to concave.

There are also larger hills used, but not at the Olympics. These are termed ski flying hills, in which the K-point is at 180-185 metres, usually, although the largest hill is at Vikersund, Norway, with a K-point of 195 metres. Ski flyers often jump over 200 metres, with the current world best 246.5 metres (809 feet), set by Norwegian Johan Evensen on the Vikersund hill in February 2011.

In addition to the K-point, jumping hills used to be measured by Table Point, but this was usually within a few metres of the K-point and K-point was used more frequently. Table Point was introduced at the Olympics in 1972, but in 1984 Table Point and K-point became synonymous and Table Point is no longer used.

Another measurement now seen is called the Hill Size, which is larger than the K-point or Table Point. Hill Size is measured to the end of the landing area, or L-point, which is beyond the K-point. Another measurement that may be seen is called the Norm Point, which measures the distance to the P-point, or the beginning of the landing area, which is just above the K-point, usually approximately 80% of the distance to the K-point. The area between the P-point and the L-point, which includes the K-point, is basically the flat part of the landing area, where it is safe for the jumpers to land. See the accompanying diagram from the FIS rules, which also shows the complexity of the design of a ski jumping hill:


SkiJumpHills


There are occasions in ski jumping where the jumpers will start “out-jumping the hill.” This is when, because of ideal conditions of wind, snow, or ice, the jumpers start landing well-below the K-point, and especially below the L-point. If that happens, it can be dangerous for the jumpers because they are not coming down in the landing area, and the officials may stop the competition, and re-start it with a lower start on the jumping hill in-run.

The Fédération Internationale de Ski (FIS) uses Hill Size to define which events must be held at the Olympics and World Championships. “OWG [Olympic Winter Games] and WSC [World Ski Championships] jumping competitions shall be held on hills of two different sizes. A World or Olympic champion will be selected for each hill size. The smaller hill should have a Hill Size (HS) of at least 100 [m]. The difference between the hill sizes must be at least 25 m.” (see http://www.fis-ski.com/inside-fis/document-library/ski-jumping/, under link Ski Jumping, and then International Competition Rules, p. 66)

The FIS actually defines hills by Hill Size, with the current specifications as follows: 1) Small hill – up to 49 m; 2) Medium hill – 50-84 m; 3) Normal hill – 85-109 m; 4) Large hill – 110 m and larger (presumably up to 184 m); 5) Flying hill – 185 m and larger.

Below are the measurements of all the Olympic ski jumping hills since 1924:

Olympic Ski Jump Hills Specifications

Normal Hill

Year              K-Point      Table Point            Hill Size

1924              71.0 m                    —                     —

1928              66.0 m                    —                     —

1932              61.0 m                    —                     —

1936              80.0 m                    —                     —

1948              68.0 m                    —                     —

1952              72.0 m                    —                     —

1956              72.0 m                    —                     —

1960              80.5 m                    —                     —

1964              78.0 m                    —                     —

1968              70.0 m                    —                     —

1972              86.0 m             78.0 m                     —

1976              82.0 m             77.0 m                     —

1980              86.0 m             78.0 m              94.0 m

1984              90.0 m             90.0 m                     —

1988              89.0 m                    —                  95.0 m

1992              90.0 m                    —                  96.0 m

1994              90.0 m                    —               100.0 m

1998              90.0 m                    —                  98.0 m

2002              90.0 m                    —               100.0 m

2006              95.0 m                    —               106.0 m

2010              95.0 m                    —               106.0 m

2014              95.0 m                    —               106.0 m

Large Hill

Year              K-Point      Table Point            Hill Size

1964              81.0 m                    —                     —

1968              90.0 m                    —                     —

1972             110.0 m           100.0 m                     —

1976             104.0 m             95.0 m                     —

1980             114.0 m           102.0 m            125.0 m

1984             112.0 m           112.0 m                     —

1988             114.0 m                    —                122.0 m

1992             120.0 m                    —                132.0 m

1994             123.0 m                    —                138.0 m

1998             120.0 m                    —                131.0 m

2002             120.0 m                    —                134.0 m

2006             125.0 m                    —                140.0 m

2010             125.0 m                    —                140.0 m

2014             125.0 m                    —                140.0 m

One thing to note is that the hills for Torino (2006), Vancouver (2010), and Sochi (2014) are exactly the same size, both in terms of K-point and Hill Size. The other thing of interest is that until 2006, both the normal hill and large hill tended to get bigger at each Olympics.

Finally, note that the normal hill used at the 2002-10 Winter Olympics, at a hill size of 106.0 m, is approaching the maximum for a normal hill (109.0 m), as defined by FIS regulations. The large hills, however, remain well below ski flying specifications and could theoretically be made larger at future Olympics.

Death at the Olympics

At Vancouver in 2010, Georgian luger Nodar Kumaritashvili went off the course during a training run on the morning of the Opening Ceremony, crashing into a stanchion next to the track, and was killed instantly. This cast a pall over the Opening Ceremony, where a moment of silence was held in his memory, and the Vancouver Games in general, and was later termed by former IOC President Jacques Rogge as the worst moment of his Presidency.

This was not the first time athletes have died at the Olympics, nor was it the first time a luger died in training runs at the Olympics. The best known instance of death at the Olympics, of course, occurred at the 1972 München Summer Olympics when Arab terrorists from the Black September faction invaded the Israeli section of the Olympic Village at 31 Connollystraße and kidnapped and killed 11 Israeli athletes and coaches, with five Israeli Olympic athletes dying either from a shoot-out or bombs at the Fürstenfeldbruck air base. The athletes killed were David Berger (WLT), Ze’ev Friedman (WLT), Eliezer Halfin (WRE), and Yossef Romano (WLT), and Mark Slavin, a wrestler who was scheduled to compete on the day of the attacks. The coaches and administrators killed were Yossef Gutfreund, Amitzur Shapira, Kehat Shorr, Andrei Spitzer, Yacov Springer, and Moshe Weinberg.

Other athletes have died during training at the Olympic site. In 1964 at Innsbruck, two athletes died during training events just prior to the start of the Winter Olympics. In a macabre coincidence, one was another luger who crashed off the course, Polish-born British luger Kazimierz Kay-Skrzypecki, while the other was Australian downhill skiier Ross Milne. The IOC had the Olympic Flag flown at half-mast throughout the Games, with two black ribbons attached to its bottom edge.

Only two Olympians have died during, or as the result of, actual Olympic competition in medal events. The first was Portuguese marathoner Francisco Lázaro who collapsed during the 1912 marathon race, and died early the next morning. The second was Danish cyclist Knut Enemark Jensen, who collapsed during the 1960 cycling team time trial and died shortly thereafter. It was a very hot day in Rome when Enemark Jensen collapsed. His death has been variously attributed to heatstroke, to a closed head injury from striking his head when he fell (he did not wear a helmet, as was standard in that era), or from the effects of drugs, as he was rumored to have had Ronicol, an amphetamine-like stimulant, in his blood at the time of his death. (Note: Multiple different versions of the cause of death and the status of his drug-related blood tests can be found.) Jensen’s death, and the later death of British cyclist Tom Simpson during an ascent of Mont Ventoux during the 1967 Tour de France, after which he was found to have had multiple drugs in his body, were the stimuli that prompted the IOC to begin testing for drugs at the 1968 Olympics. Another Olympic athlete died during a demonstration event at the 1936 Berlin Olympics when Austrian Ignaz Stiefsohn crashed during the gliding exhibition, and was killed instantly.

Preparing the courses can be dangerous as well at the Winter Olympics. In 1992 at Albertville speed skiing was a demonstration sport. Swiss speed skiier Nicolas Bochatay was warming up before the qualifying with his teammate Pierre-Yves Jorand. They came up over a blind mogul, but when landing on the other side, Bochatay crashed into the track of a Sno-Cat preparing the course and was killed from internal injuries he suffered. Jorand was uninjured but withdrew from the competition.

At Calgary in 1988 a similar incident occurred before the start of the second run of men’s giant slalom. The 47-year-old Austrian team physician and orthopaedic surgeon Jörg Oberhammer, who was skiing at the base of the hill, collided with another skier, 55-year-old Brian Nock, a technician for Canadian television. Oberhammer was knocked down into the tracks of a snow-grooming machine and was crushed, killing him instantly. Two Swiss skiers, Pirmin Zurbriggen and Martin Hangl, witnessed the event and were badly shaken. Zurbriggen managed to start the second run and would win a bronze medal, but Hangl collapsed at the top of the hill and had to withdraw.

There have been other Olympics-related deaths, more due to acts of God or accidents and not related to training, course preparation, or competition. In 1936 at Berlin, Romanian boxer Nicolae Berechet lost his first round match in the featherweight class on 11 August. In that pre-antibiotic era, three days later he was dead of sepsis from an infection due to a carbuncle. At the 1956 Melbourne Olympics, Italian rower Arrigo Menicocci competed and then a few days later went for a car ride, but was killed in a crash before the Olympics had ended. One other athlete who died during the Olympics, but without ever competing, was Czechoslovakian female gymnast Eliska Mišaková. While training in London before the 1948 Olympics Mišaková contracted poliomyelitis and died on the day the gymnastics competition started. Her sister, Miroslava, was also on the Czechoslovak team and helped them win a gold medal.

Finally, shortly after midnite on 27 July 1996 at the Atlanta Olympics, a bomb went off in Centennial Olympic Park, a gathering place for the world’s spectators and many of the athletes. One spectator, Alice Hawthorne, was killed by the bomb and 111 others were wounded. One Turkish cameraman, Melih Uzunyol, ran to the scene to photograph it, and died of a heart attack he sustained in that effort. The bombing was initially attributed to Centennial Olympic Park employee Richard Jewell, who was wrongly accused, but was later found to have been set by Eric Rudolph, a religious extremist who seemed to be anti-almost everything except life. He was found to have set other bombs as well, was convicted, and in a plea bargain, sentenced to four consecutive life sentences without parole.

So the Olympic Games usually celebrate athletes and humanity at its finest. But they have also been the scene of great tragedy. All honor to their names.

And now, a moment a silence for those who died and have not always been given that memory.

(Note: the above was written prior to the recent terrorist attacks in Volgograd. We sincerely hope and pray that no amendments will be necessary by the end of the Sochi Olympic Games.)

Sochi – the Olympic Program

There will be 98 events contested at Sochi, with 49 events for men, 43 for women, and 6 mixed events, although we’ll have a bit more to say about mixed events in a bit. Now that ski jumping has been added, women will compete in every sport/discipline on the Sochi Program except Nordic combined. Women are underrepresented on the Olympic Winter Program with 1 bobsledding event to 2 for men, 1 ski jumping event to 3 for men, and no events in Nordic combined to 3 for men.

Winter sports/events came into the Olympics in 1908, with figure skating contested as part of the 1908 and 1920 Olympic Games, and ice hockey also contested at Antwerp in 1920. Since then the Olympic Program breakdown has looked like this:

Years   Men  Women  Mixed  Total    %Wom      %Mix

1908            2            1            1            4         25.0%       25.0%

1920            2            1            1            4         25.0%       25.0%

1924           14           1            1          16           6.3%         6.3%

1928           12           1            1          14           7.1%         7.1%

1932           12           1            1          14           7.1%         7.1%

1936           14           2            1          17         11.8%         5.9%

1948           17           4            1          22         18.2%         4.5%

1952           16           5            1          22         22.7%         4.5%

1956           17           6            1          24         25.0%         4.2%

1960           16         10            1          27         37.0%         3.7%

1964           20         12            2          34         35.3%         5.9%

1968           21         12            2          35         34.3%         5.7%

1972           21         12            2          35         34.3%         5.7%

1976           22         12            3          37         32.4%         8.1%

1980           23         12            3          38         31.6%         7.9%

1984           23         13            3          39         33.3%         7.7%

1988           27         16            3          46         34.8%         6.5%

1992           31         23            3          57         40.4%         5.3%

1994           33         25            3          61         41.0%         4.9%

1998           36         29            3          68         42.6%         4.4%

2002           41         34            3          78         43.6%         3.8%

2006           44         37            3          84         44.0%         3.6%

2010           45         38            3          86         44.2%         3.5%

2014           49         43            6          98         43.9%         6.1%

Totals      509       307         46       862        35.6%         5.3%

From 1976-2010 the mixed events were pairs figure skating, ice dance figure skating, and doubles luge, although the luge event is an anomaly. Technically the event is open to men and women as a mixed event. But no woman has ever competed in doubles luge at the Olympic Winter Games or World Championships, nor is the option ever really discussed or considered. Thus, there is some justification to consider it a men’s event.

There are 12 more events on the Sochi Program than there were at Vancouver in 2010. The new events are as follows, along with the time at which they first were contested at World Championships:

Biathlon                  X   Mixed Relay                2005 World Championship

Figure Skating      X   Team Trophy              never contested at Worlds

Freestyle Skiing  M  Slopestyle                    2011 World Championship

Freestyle Skiing  M  Halfpipe                        2005 World Championship

Freestyle Skiing   F   Slopestyle                    2011 World Championship

Freestyle Skiing   F   Halfpipe                        2005 World Championship

Luge                            X   Mixed Relay               1989 World Championship

Ski Jumping            F   Normal Hill, Indiv.   2009 World Championship

Snowboarding     M  Slopestyle                    2011 World Championship

Snowboarding     M  Parallel Sp. Slalom   1996 World Championship

Snowboarding      F   Slopestyle                     2011 World Championship

Snowboarding      F   Parallel Sp. Slalom    1996 World Championship

The figure skating team trophy is interesting, in that it has not been contested at the World Championships. The Olympic Charter used to state that events would only be added if they had first been contested at international competitions, “To be included in the programme of the Olympic Games, events must have a recognised international standing both numerically and geographically, and have been included at least twice in world or continental championships.” That was in the 2004 Olympic Charter, but that text was removed in the next edition, in 2007.

So women are getting closer to full gender equity at the Winter Olympics. They can actually now compete in 50.0% of the events on the program, although only technically, remembering doubles luge. Men can compete in 56.1% of the events, because of the overlap with mixed events.

If women’s ski jumping is successful and expands internationally, it is possible the program will become all but equal, but it is important to remember that Nordic combined events for women are held virtually nowhere and there have been no international competitions in that discipline for women. A recent story talked about Russian women starting to compete in Nordic combined and it was most notable for the rarity of women in that sport. Hard to imagine women’s Olympic events in Nordic combined in the foreseeable future.

Olympic Sliding Tracks

Unfortunately, all Olympic fans sadly remember the death of Georgian luger Nodar Kumaritashvili, on the morning of the 2010 Vancouver opening ceremony. There were concerns about the track in Vancouver and its speed and difficulty. What is the sliding track like in Sochi, at the Sanki Sliding Centre? And how does it compare to Vancouver and other Olympics sliding tracks?

Below are the specifications for the Olympic sliding tracks at all the Olympics, although in some of the early years, some data is lacking. The three key factors are the length of the track, the gradient, or steepness of the hill, and especially the vertical drop.

Olympic Bobsledding Track Specifications

Two-Man

Year    Curves   Length  Start Altitude  Vertical Drop   Gradient

1932           26   2,366 m              850 m               228 m          9.6%

1936           17   1,525 m               919 m               129 m          8.5%

1948           17   1,722 m                       —               130 m          7.5%

1952           13   1,508 m               429 m               124 m          8.2%

1956           16   1,700 m                       —               153 m          9.0%

1964           13   1,506 m           1,133 m               138 m          9.2%

1968           13   1,500 m           2,030 m               140 m          9.3%

1972           14   1,563 m               495 m                 70 m          4.5%

1976           14   1,220 m            1,133 m                 97 m          8.0%

1980           16   1,557 m               771 m               148 m          9.5%

1984           13   1,300 m           1,109 m               126 m          9.7%

1988           14   1,475 m           1,250 m               120 m          8.1%

1992           19   1,508 m           1,685 m               125 m          8.3%

1994           16   1,365 m               347 m               107 m          7.8%

1998           15   1,360 m           1,028 m               113 m          8.3%

2002           15   1,340 m           2,233 m               104 m          7.8%

2006           19   1,435 m           1,683 m               114 m          7.9%

2010           16   1,450 m              928 m               148 m        10.2%

2014           18   1,475 m               844 m               132 m          9.3%

Four-Man

Year    Curves   Length  Start Altitude  Vertical Drop   Gradient

1924           19   1,370 m                        —               156 m        11.4%

1928           17   1,722 m                        —               130 m          7.5%

1932           26   2,366 m              850 m               228 m          9.6%

1936           17   1,525 m               919 m               129 m          8.5%

1948           17   1,722 m                        —               130 m          7.5%

1952           13   1,508 m                429 m               124 m          8.2%

1956           16   1,700 m                        —               153 m          9.0%

1964           13   1,506 m           1,133 m               138 m          9.2%

1968           13   1,500 m           2,030 m               140 m          9.3%

1972           14   1,563 m                495 m                 70 m          4.5%

1976           14   1,220 m            1,133 m                 97 m          8.0%

1980           16   1,557 m               771 m               148 m          9.5%

1984           13   1,300 m           1,109 m               126 m          9.7%

1988           14   1,475 m           1,250 m               120 m          8.1%

1992           19   1,508 m           1,685 m               125 m          8.3%

1994           16   1,365 m               347 m               107 m          7.8%

1998           15   1,360 m           1,028 m               113 m          8.3%

2002           15   1,340 m           2,233 m               104 m          7.8%

2006           19   1,435 m           1,683 m               114 m          7.9%

2010           16   1,450 m              928 m               148 m        10.2%

2014           18   1,475 m               844 m               132 m          9.3%

Two-Women

Year    Curves    Length  Start Altitude  Vertical Drop   Gradient

2002           15   1,340 m           2,233 m               104 m          7.8%

2006           19   1,435 m           1,683 m               114 m          7.9%

2010           16   1,450 m               928 m               148 m        10.2%

2014           18   1,475 m               844 m               132 m          9.3%


Olympic Luge Track Specifications

Men’s Singles

Year    Curves   Length  Start Altitude  Vertical Drop   Gradient

1964           18   1,058 m           1,133 m               113 m        10.7%

1968           14   1,000 m           1,110 m               110 m        11.0%

1972           14   1,023 m                443 m               101 m          9.9%

1976           14   1,220 m                        —               103 m          8.4%

1980           14   1,014 m                731 m                 96 m          9.5%

1984           13   1,210 m           1,112 m               129 m        10.7%

1988           13   1,251 m           1,309 m               109 m          8.7%

1992           15   1,250 m           1,671 m               111 m          8.9%

1994           16   1,365 m                350 m               110 m          8.1%

1998           14   1,326 m           1,029 m               114 m          8.6%

2002           17   1,317 m                    —               106 m              8.0%

2006           19   1,435 m                    —               114 m              7.9%

2010           15   1,198 m              909 m               132 m        11.0%

2014           17   1,475 m              844 m               132 m           9.3%

Doubles

Year    Curves   Length  Start Altitude  Vertical Drop   Gradient

1964           18      910 m           1,110 m                 89 m           9.8%

1968           —               —                        —                       —                —

1972           11      763 m               420 m                 78 m        10.2%

1976           10      870 m                        —                 72 m           8.3%

1980           11      749 m              695 m                 59 m          7.9%

1984           11      993 m           1,082 m               100 m        10.1%

1988           10   1,080 m           1,281 m                 81 m          7.5%

1992           14   1,143 m           1,652 m                 92 m          8.0%

1994           13   1,185 m                325 m                 85 m          7.2%

1998           13   1,194 m           1,011 m                  96 m          8.0%

2002           12   1,140 m                        —                  77 m          6.8%

2006           17   1,233 m                        —                  98 m          7.9%

2010           14      953 m                883 m                 96 m        10.1%

2014           16   1,384 m                836 m               125 m          9.3%

Women’s Singles

Year    Curves     Length    Start Altitude    Vertical Drop     Gradient

1964           18      910 m           1,110 m                 89 m          9.8%

1968           —               —                        —                        —              —

1972           11      763 m                420 m                 78 m        10.2%

1976           10      870 m                        —                  72 m          8.3%

1980           11      749 m                695 m                 59 m          7.9%

1984           11      993 m            1,082 m               100 m        10.1%

1988           10   1,080 m            1,281 m                 81 m          7.5%

1992           14   1,143 m            1,652 m                 92 m          8.0%

1994           13   1,185 m                325 m                 85 m          7.2%

1998           13   1,194 m            1,011 m                 96 m          8.0%

2002           12   1,140 m                        —                  77 m          6.8%

2006           17   1,233 m                        —                  98 m          7.9%

2010           14        953 m               883 m                 96 m        10.1%

2014           16   1,384 m                836 m               125 m          9.3%


Olympic Skeleton Track Specifications

Men

Year    Curves   Length  Start Altitude  Vertical Drop   Gradient

1928           15   1,231 m                       —               157 m        12.8%

1948           15   1,231 m                       —               157 m        12.8%

2002           15   1,335 m           2,233 m               104 m          7.8%

2006           19   1,435 m           1,683 m               114 m          7.9%

2010           15   1,450 m              928 m               148 m        10.2%

2014           18   1,475 m              844 m               132 m         9.3%

Women

Year    Curves   Length  Start Altitude  Vertical Drop   Gradient

2002           15   1,335 m           2,233 m               104 m          7.8%

2006           19   1,435 m           1,683 m               114 m          7.9%

2010           15   1,450 m              928 m                148 m        10.2%

2014           18   1,475 m              844 m                132 m          9.3%

If everything else is equal, the vertical drop is what determines the speed. On a frictionless track, with no curves, the velocity one obtains would be as follows, if you remember your elementary physics:

V = √2gh

In the above, V = velocity, h = vertical drop (or height), and g = gravitational acceleration (=9.8 m/s). With no other forces, such as friction, the speed at the bottom can be determined by the equation relating potential and kinetic energy:

mgh = ½mV2

Which yields the above formula for the final velocity.

Now obviously there is friction, and there are curves. Modern sliding tracks really began in the 1960s with refrigerated tracks which are basically sheets of ice. Friction is pretty minimal now, but its still there. And some of the curves will slow down the sleds, although the highly banked tracks minimize that.

So looking at the above, we note that the Sanki track is a long one, at a maximum length of 1,475 metres. It is the longest ever luge or skeleton Olympic track, although several bob tracks have been longer.

The Vancouver track had a greater vertical drop and gradient than Sochi, however. In fact Vancouver had the steepest gradient and biggest vertical drop of any of the modern, iced Olympic tracks, although equalled by Lake Placid in 1980, which had the same vertical drop but less of a gradient. For bobsled and skeleton, the track in Vancouver dropped 148 metres at a gradient of about 10.2%, while Sochi drops 132 metres at a gradient of about 9.3%. The luge drop in Vancouver was less, but remember that that track was shortened, and started from lower down, after the fatal accident.

So if you are looking at the differences in the two tracks maximal potential speeds, they are as follows (using bobsled and skeleton drops):

Year           Vertical Drop                         Max Speed

2010          148 m drop        194 km/hr (121 mph)

2014          132 m drop        183 km/hr (114 mph)

Now obviously the sleds never get that fast, as this assumes a frictionless surface and no curves. Maximum speeds hover about 90 mph, or 145 km/hr in skeleton and luge, and can get to 95 mph, or 150 km/hr in bobsled. But what this does show is that the Sanki Sliding Centre track is not as fast as Vancouver’s was, by a factor of about 6% potential maximum speed.
Sochi – The Costs

The rumor is afloat that the Sochi Olympics will cost $51 billion (US). Does that make these the most expensive Olympic Games ever? In a word, yes, but please remember that determining the cost of an Olympics is fraught with complex issues, and it is really difficult to say how much each Olympic Games cost. Further, the world has changed over the years, with inflation eroding the value of a dollar, or a Euro, or a ruble. Obviously, the Olympic Games have also changed, with more athletes at each Olympics, and more events.

There are two costs to an Olympic Games, or Olympic Winter Games. The costs of hosting the Olympics – building venues, building the Olympic Village, hiring the administration for seven years, bidding for the Games (which now costs 10s of millions), hiring security, now a major cost, and many other costs of hosting. Infrastructure is more a civic line item – what the city does to gussy itself up for the world’s visitors, and for the future use of the city’s population (or village for Lake Placid, or neighborhood for Squaw Valley).

As an example, in 1996, Atlanta greatly upgraded Hartsfield International Airport, readying it for the influx of Olympic visitors. Is that an Olympic cost? Some would say yes, but Atlanta’s airport needed a major upgrade – it was due, and using the Olympic host responsibilities as a pretext allowed the city to justify that upgrade and offload the cost, somewhat, to the Olympic costs.

In 2004, Athens built a major circumferential highway around the city, and a new major train line from Athens city centre to Piraeus, the Athenian port city. Both were civic improvements that Athens sorely wanted and needed and the Olympics allowed them to justify building those. In both Atlanta’s and Athens’ cases, those new building projects improved the cities for years to come. Are those Olympic costs – or simply civic improvements?

There is no way to know for certain, and no way to be certain of the accounting. So we have to go on the usually published numbers, and in Sochi’s case that number is 51 billion US dollars.

But we should definitely correct for inflation, adjusting costs for previous Games to current dollars. And there are other ways to compare costs. The more athletes at an Olympics, the more it costs to run the Olympic Games themselves. The Olympic Village has to be larger. You have to protect each athlete with more security, you have to transport the athletes, you have to feed the athletes. So a better way to look at Olympic costs is to compare fixed costs against inflation per number of athletes at the Games.

Further I would say that it is important to also compare against the number of events at the Games. The more events, the more sports. The more sports, the more venues. For each additional venue, there are usually building costs. For each additional event, you have to provide more security for that event. Currently, the two biggest costs to an OCOG (Organizing Committee of the Olympic Games) are the cost of building venues (has always been #1 cost) and the cost of providing security. So perhaps an ever finer way to drill down is to look at Olympic costs against inflation per number of athletes, per number of events at the Games.

So here are the numbers for Sochi, the last four Winter Olympics, the last two Summer Olympics, and also looking at Tokyo in 1964, using usually quoted cost figures. Why Tokyo? Because prior to Beijing in 2008, Tokyo was the most expensive Summer Olympics ever, per number of athletes, and per number of athletes and events.

Olympic Costs     Constant $                                   Constant $   Constant $

Year  Host City  (mill 2012$)  Events  Athletes  Per Athlete  Per Ath/Evt

1964  Tokyo             $14,162        163       5,137  $2,755,415         $16,904

2008  Beijing           $31,987        302     10,901  $2,934,629           $9,705

2012  London          $14,460        302     10,520  $1,374,394          $4,551

1998  Nagano         $14,078          68       2,180  $6,457,985         $94,970

…………………………….$1,267                                          $581,193            $8,547

2002  Salt Lake C    $2,551          78       2,399  $1,062,068         $13,616

2006  Torino               $4,665          84       2,494  $1,870,408         $22,267

2010  Vancouver      $7,376          86       2,536  $2,908,401         $33,819

2014  Sochi               $51,000          98  2,700e $18,888,889      $192,744

Several things are evident in the above. First, prior to Sochi the most expensive Olympics, inflation adjusted cost per athlete (IACPA), and in inflation adjusted cost per athlete per event (IACPAPE), was Nagano in 1998. But Nagano is tricky. There are two figures usually quoted for its costs – either $10 billion (US), or $900 million (US) (adjusted to 2012 figures above), which are nowhere near close to each other, and obviously reflect the costs of hosting versus the cost of hosting plus infrastructure. Nagano had to almost create a winter resort from scratch and build train lines from Tokyo and other major cities to get people there, so their infrastructure costs were huge.

But even using the bigger number for Nagano, and using the $51 billion # for Sochi, Sochi will be three times as expensive in IACPA, and twice as expensive in IACPAPE. Comparing to Beijing, the previously acknowledged champion for Olympic costs at $30 billion in 2008, Sochi is way more expensive per athlete and per athlete/per event. In fact that’s not even close when looking at IACPAPE. And check out the $ figure per athlete at about $19 million – that makes every Winter Olympian in 2014 about the value of Peyton Manning, per the Sochi OCOG. And you thought the Yankees overspent?

Secondly, when you compare Beijing to Tokyo, adjusted for inflation and number of athletes, Beijing and Tokyo cost almost the same amount of money. And if you compare per athlete/per event, Tokyo was still more expensive than Beijing.

Finally, from the above it is obvious that Olympic Winter Games are actually more expensive than Summer Games when comparing against # of athletes and # of events. There are fewer athletes (about ¼th as many as the Summer Games) and fewer events (now about ⅓rd as many), but you still gotta build Olympic Villages, build venues, and provide security. In fact, at Winter Games you usually need to build two Olympic Villages now – one in the mountains and one near the city centre for indoor events.

So anyway you figure it, Sochi will be a very expensive Olympic Games, and definitely the most expensive Olympic Games ever conducted. And are these numbers conservative with security costs likely to skyrocket after the terrorist attacks in Volgograd? Will it be worth it for Sochi and the region of Krasnodar Kray? Will the new facilities bring tourists in the winter, and in Sochi’s case, even in the summer by the Black Sea? Or will those facilities lay fallow, as Olympic white elephants, similar to so many of the facilities in Sarajevo, Athens, or Beijing, and many other Olympic host cities? Only time will let us know.

Speed Skating Records – What Not to Look For at Sochi

Will there be any world records set in speed skating at Sochi, referring to long-track? Probably not. How about Olympic records? Maybe, but not a lot, if any. Why is that? Because much more so than athletics (track & field) and swimming, long-track speed skating records are almost entirely dependent on the oval where one is skating.

Speed skating ovals used to always be outdoor rinks, but on 17 November 1986 the first two indoor ovals opened – the Berlin Hohenschönhausen in East Berlin, and the Dutch rink Thialf at Heerenveen. In 1988 the Calgary Winter Olympics had an indoor oval used for speed skating for the first time at the Olympics. In 1992 the Albertville rink was outdoors, once again, but since 1994, when the speed skating events were contested at the Vikingskipet in Hamar (near Lillehammer), all Olympic speed skating ovals have been indoors on artificial ice. The weather was quite poor at Albertville and after the 1992 Winter Olympics, the ISU mandated that Olympic ovals had to be indoors.

Prior to 1986 world records were routinely set at only a few ovals, for various reasons. One is that many of the major competitions were contested there, such as at Davos, Switzerland, or Inzell, West Germany. The other is that certain rinks were renowned for having good ice conditions. The absolute speed factory among outdoor rinks was the Medeo oval at Alma-Ata (now Almaty), Kazakhstan, in the former Soviet Union. Not only was Medeo known for good ice, it was at very high altitude (1,691 m), lessening the wind resistance, and in addition, Medeo was in a valley, and seemed to often have following winds that circled completely around the oval at all-times, making all marks seem wind-aided.

But once indoor rinks came into being, almost all world records have been set there. And further, they have been set primarily in two places – Calgary and Salt Lake City. The reason is two-fold. Both are known for excellent ice, but they are also at altitude, with both over 1,000 metres in elevation – Salt Lake City is slightly higher at 1,288 m to Calgary’s 1,045 m. Since the Salt Lake City oval opened in 2001, many all the world records have been set there.

Let’s look at the numbers, by Olympic event:

Men

500      last 10 WR at Calgary/SLC – 13 of the last 16 since 1988, the last four at SLC

1,000    last 20 WR at Calgary/SLC – 21 of the last 23 since 1988, the last six at SLC

1,500    last 12 WR at Calgary/SLC going back to 1998

5K        last 8 WR at Calgary/SLC going back to 1998

10K      a bit different with 4 Calgary and 3 Salt Lake City WRs, out of 13 since 1987

Women

500      last 19 WR at Calgary/SLC – 14 at Calgary and 5 at SLC, going back to 1987

1,000    last 14 WR at Calgary/SLC – 10 at Calgary and 4 at SLC, going back to 1987

1,500    9 of 10 WR at Calgary/SLC – 6 at Calgary and 3 at SLC, going back to 1997

3K        10 of 14 WR at Calgary/SLC – 9 at Calgary and 1 at SLC, going back to 1987

5K        7 of 12 WR at Calgary/SLC – 3 at Calgary and last 4 at SLC, going back to 1988

The anomaly in the above was the women’s 1,500 record with Karin Kania-Enke’s mark of 1:59.30 from 22 March 1986 lasting for 11 years – until 29 November 1997. But it was set at Medeo. You can also see that the effect is more pronounced in the shorter races, where the decreased air resistance of altitude is more effective. In the longer races, the oxygen debt takes over.

So what about Sochi? The Adler Arena opened in 2012 and hosted the 2013 Single-Distance World Championships. But Adler Arena is at the Coastal Cluster by the Black Sea, at an altitude of about 65 metres. Any world record set here will be an impressive performance. Here are the Sochi oval records compared to the current world records (as 1 January 2014):

Men

Sochi

500        Jan Smeekens (NED)                      34.80

1,000    Denis Kuzin (KAZ)                       1:09.14

1,500    Denis Yuskov (RUS)                    1:46.32

5K          Sven Kramer (NED)                     6:14.41

10K       Jorrit Bergsma (NED)             12:57.69

World Record                                               Site              Year

500        Jeremy Wotherspoon (CAN)     34.03   Salt Lake      2007

1,000    Shani Davis (USA)                        1:06.42   Salt Lake      2009

1,500    Shani Davis (USA)                        1:41.04   Salt Lake      2009

5K          Sven Kramer (NED)                     6:03.32   Calgary         2007

10K       Sven Kramer (NED)                 12:41.69   Salt Lake      2007


Women

Sochi

500         Lee Sang-Hwa (KOR)                  37.65

1,000    Olga Fatkulina (RUS)               1:15.44

1,500    Ireen Wüst (NED)                     1:55.38

3K          Ireen Wüst (NED)                     4:02.43

5K          Martina Sábliková (CZE)       6:54.31

World Record                                               Site              Year

500        Lee Sang-Hwa (KOR)                 36.36   Salt Lake      2013

1,000    Brittany Bowe (USA)             1:12.58   Salt Lake      2013

1,500    Cindy Klassen (CAN)             1:51.79   Salt Lake      2005

3K          Cindy Klassen (CAN)              3:53.34   Calgary         2006

5K          Martina Sábliková (CZE)       6:42.66   Salt Lake      2011

Two things are immediately apparent from that list. The Sochi marks, set at a World Championship, are not close to the world records, in any event, and every current world record has been set at either Calgary or Salt Lake City.

Even comparing the Sochi records to Olympic records, Sochi comes out behind usually.

Men

Sochi

500        Jan Smeekens (NED)                      34.80

1,000    Denis Kuzin (KAZ)                       1:09.14

1,500    Denis Yuskov (RUS)                    1:46.32

5K          Sven Kramer (NED)                     6:14.41

10K       Jorrit Bergsma (NED)             12:57.69

Olympic Record                                            Site              Year

500        Casey FitzRandolph (USA)       34.42   Salt Lake      2002

1,000    Gerard van Velde (NED)        1:07.18   Salt Lake      2002

1,500    Derek Parra (USA)                    1:43.95   Salt Lake       2002

5K          Sven Kramer (NED)                  6:14.60   Vancouver    2010

10K       Lee Seung-Hun (KOR)          12:58.55   Vancouver    2010


Women

Sochi

500        Lee Sang-Hwa (KOR)                 37.65

1,000    Olga Fatkulina (RUS)            1:15.44

1,500    Ireen Wüst (NED)                  1:55.38

3K          Ireen Wüst (NED)                   4:02.43

5K         Martina Sábliková (CZE)      6:54.31

Olympic Record                                            Site              Year

500        Catriona Le May Doan (CAN)   37.30   Salt Lake      2002

1,000    Chris Witty (USA)                       1:13.83   Salt Lake      2002

1,500    Anni Friesinger (GER)              1:54.02   Salt Lake      2002

3K          Claudia Pechstein (GER)         3:57.70   Salt Lake      2002

5K          Claudia Pechstein (GER)         6:46.91   Salt Lake      2002

So don’t look for too many speed skating records at Sochi. Which ones are vulnerable for Olympic marks? The men’s 10K is at high risk – Sven Kramer skated 12:46.96 earlier in 2013 at Heerenveen (sea level), the second fastest time ever, and then bettered that at the Dutch trials at Heerenveen, with 12:45.08 on 28 December 2013. Lee Sang-Hwa could also better Le May Doan’s 500 mark, and Casey FitzRandolph’s men’s 500 is at risk.

Most Winter Olympic Appearances

Todd Lodwick recently qualified for his 6th US Olympic team in Nordic combined. He will become the first American to compete at 6 Winter Olympics, although that only ties the record held by 16 men and 4 women. The lists for most appearances at the Winter Olympics by men and women are as follows, with the US records at the bottom of each list.

Note that of the 5 men and 1 woman who competed in their 6th Winter Olympics at Vancouver in 2010, we expect two of them to compete in Sochi to set a record with their 7th Winter Olympic appearance – Albert Demchenko of Russia in luge and Noriaki Kasai of Japan in ski jumping.

Appearances – Men, Winter

6           Carl-Erik Eriksson (SWE-BOB; 1964/68/72/76/80/84)

6           Colin Coates (AUS-SSK; 1968/72/76/80/84/88)

6           Alfred Eder (AUT-BIA; 1976/80/84/88/92/94)

6           Jochen Behle (FRG/GER-CCS; 1980/84/88/92/94/98)

6           Harri Kirvesniemi (FIN-CCS; 1980/84/88/92/94/98)

6           Mike Dixon (GBR-BIA/CCS; 1984/88/92/94/98/02)

6           Raimo Helminen (FIN-ICH; 1984/88/92/94/98/02)

6           Markus Prock (AUT-LUG; 1984/88/92/94/98/02)

6           Sergey Chepikov (EUN/RUS/URS-BIA/CCS; 1988/92/94/98/02/06)

6           Georg Hackl (FRG/GER-LUG; 1988/92/94/98/02/06)

6           Wilfried Huber (ITA-LUG; 1988/92/94/98/02/06)

6           Ilmārs Bricis (LAT-BIA; 1992/94/98/02/06/10)

6           Marco Büchel (LIE-ASK; 1992/94/98/02/06/10)

6           Andrus Veerpalu (EST-CCS; 1992/94/98/02/06/10)

6           Albert Demchenko (EUN/RUS-LUG; 1992/94/98/02/06/10)

6           Noriaki Kasai (JPN-SKJ; 1992/94/98/02/06/10)

5           Brian Shimer (BOB; 1988/92/94/98/02)

5           Casey Puckett (ASK/FRS; 1992/94/98/02/10)

5           Mark Grimmette (LUG; 1994/98/02/06/10)

5           Todd Lodwick (NCO; 1994/98/02/06/10)

4           Jim Bickford, Jr. (BOB; 1936/48/52/56)

4           Larry Damon (BIA/CCS; 1956/60/64/68)

4           Tim Caldwell (CCS; 1972/76/80/84)

4           Bill Koch (CCS; 1976/80/84/92)

4           Lyle Nelson (BIA; 1976/80/84/88)

4           Brent Rushlaw (BOB; 1976/80/84/88)

4           Chris Chelios (ICH; 1984/98/02/06)

4           Dan Jansen (SSK; 1984/88/92/94)

4           Eric Flaim (SSK/STK; 1988/92/94/98)

4           A J Kitt (ASK; 1988/92/94/98)

4           Chris Thorpe (LUG; 1992/94/98/02)

4           Keith Tkachuk (ICH; 1992/98/02/06)

4           Eric Bergoust (FRS; 1994/98/02/06)

4           KC Boutiette (SSK; 1994/98/02/06)

4           Daron Rahlves (ASK/FRS; 1998/02/06/10)

4           Bode Miller (ASK; 1998/02/06/10)

4           Jay Hakkinen (BIA; 1998/02/06/10)

4           Bill Demong (NCO; 1998/02/06/10)

4           Brian Martin (LUG; 1998/02/06/10)


Appearances – Women, Winter

6           Marja-Liisa Kirvesniemi-Hämäläinen (FIN-CCS; 1976/80/84/88/92/94)

6           Emese Nemeth-Hunyady (AUT/HUN-SSK; 1984/88/92/94/98/02)

6           Gerda Weissensteiner (ITA-BOB/LUG; 1988/92/94/98/02/06)

6           Anna Orlova (LAT-LUG; 1992/94/98/02/06/10)

5           24 women tied with 4 appearances.

4           Mary Docter (SSK; 1980/84/88/92)

4           Bonnie Blair (SSK; 1984/88/92/94)

4           Cammy Myler (LUG; 1988/92/94/98)

4           Ann Battelle (FRS; 1992/94/98/02)

4           Nina Kemppel (CCS; 1992/94/98/02)

4           Amy Peterson (STK; 1992/94/98/02)

4           Chris Witty (SSK; 1994/98/02/06)

4           Jennifer Rodriguez (SSK; 1998/02/06/10)

4           Catherine Raney Norman (SSK; 1998/02/06/10)

4           Sarah Schleper (ASK; 1998/02/06/10)

4           Angela Ruggiero (ICH; 1998/02/06/10)

4           Jenny Schmidgall-Potter (ICH; 1998/02/06/10)


Maki Tabata

It was announced this week that Maki Tabata has made the Japanese speed skating team for the 2014 Sochi Olympics. If you haven’t heard of you, you should have. Her Olympic medal haul contains but a single silver medal, that won in the team pursuit at Vancouver in 2010, but she holds several other Olympic bests, one coming with her being named to the 2014 Olympic roster.

In 2010 Tabata’s silver medal came 16 years after she first appeared in the Olympics, in 1994 at Lillehammer. She missed the 1998 Winter Olympics but competed again in 2002 and 2006. She competed in the 1,500 in 1994, four individual events in 2002, and five events in 2006, including the team pursuit. Her best individual finish was sixth in the 2002 3,000 metres, with a podium near-miss of fourth in the 2006 team pursuit. But Tabata’s 2010 medal set a best for women – her 16-year gap from début to first Winter Olympic medal is the longest unrequited span of Winter Olympic participation for women without a medal.

Among men, the record is 20 years by Belgium bobsledder Max Houben, who first competed in 1928 and then won his first medal in 1948. Houben can actually claim 28 years – he actually competed at the Olympics in 1920 in athletics (track & field). Houben is trailed among male Winter Olympians by ice hockey players Jari Kurri (FIN), who first competed in 1980 and won his first medal in 1998, and American Chris Chelios, who went from 1984-2002 before winning an Olympic medal. The summer record for men is 36 years by Canadian equestrian Ian Millar, who first competed in 1972 and won his first medal in 2008. For women, Danish equestrian Anne Jensen-van Olst went 20 years at the Summer Games before winning a medal – 1988-2008.

But Tabata will soon have another record, though she may share it with others. When she competes in Sochi it will make her span of Olympic participation 20 years (1994-2014) – the longest ever for women at the Winter Olympics. The current best is 18 years, held by seven female Winter Olympians. Tabata is now at 16 years, tying her for 8th-best with 13 others. However, Tabata and 11 others competed at Vancouver, so she may end up sharing this record , as final Olympic rosters are not yet complete. The men’s record, incidentally, is 26 years at the Winter Olympics – held by Costa Rican Arturo Kinch, a skiier who competed from 1980-2006, and the magnificently named Mexican alpine skiier Hubertus von Fürstenberg-von Hohenlohe, who competed from 1984-2010.